


Market Strategy
by Talley Leger, Chief Market Strategist
November 6, 2026
An “Odyssean” S&P 500 Price Target
WCG’s near-term outlook for US large market capitalization stocks is inspired by Homer’s classic epic poem, The Odyssey, in which the warrior King Odysseus bound himself to the ship’s mast to resist the Sirens’ song. In economic and monetary policy terms, that means our communication is commitment-based forward guidance.
While our 2026 outlook is admittedly behind schedule given the series of setbacks we originally identified (e.g., geopolitical conflict, AI fatigue, an inflation scare), we stand by our S&P 500 price target of 8,500 (+12%) which we believe is simply a matter of when (e.g., 1Q27), not if. In the meantime, 8,200 (+8%) may be a more realistic achievement by December 31, 2026.
3-6 Month US Equity Outlook: In our Bullish Base Case, We See the S&P 500 Rising Another ~12% to 8,500.
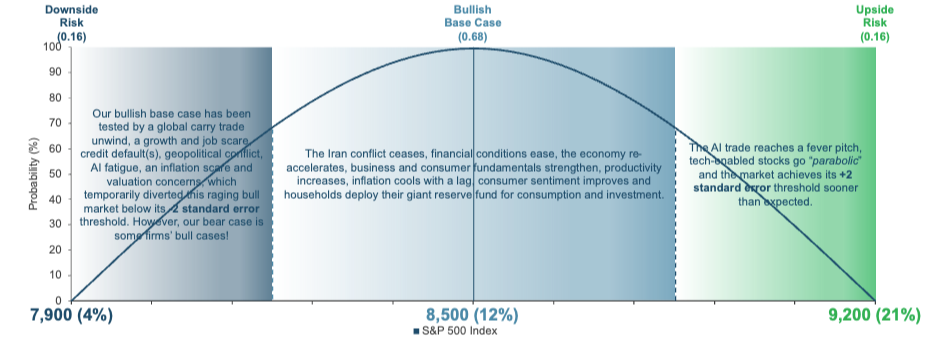
Sources: WCG, 10/30/26. Notes: For illustrative purposes. This is a hypothetical example and is not representative of any specific investment.
The Daunting Task of an S&P 500 Price Target
Despite all the anxiety about higher interest rates, US large market capitalization stocks are less than 4% below their all-time closing high. In our view, rising bond yields make sense and are reasonable, insofar as the increase is being driven by economic growth.
Recall that September and October are notorious for being some of the weakest months of the calendar year. As such, we’re inclined to look past the recent sluggishness in share prices and view stock market breadth as a glass half full, not half empty. After all, we’ve just entered the best season for US equity returns! In our humble opinion, the S&P 500 is likely to rally into 1Q27, and participation should improve alongside it because the economic and earnings expansion has plenty of runway.
Persistent pessimism in the marketplace is another key reason why we think improving risk appetite should drive stocks significantly higher from here. If correct, our estimate of 8,500 implies another 12% return on stocks through 1Q27.
Has That Ever Happened Before?
We had three consecutive years of double-digit gains from 2023 to 2025. It wouldn’t be unusual to enjoy a fourth or fifth year of double-digit gains in 2026 and 2027. Five consecutive years of double-digit gains occurred in the 1990s. A 1990s-style string of robust returns could reoccur, especially if easy financial conditions fuel tech mania 2.0.
This one’s for the history buffs: Stocks also enjoyed four back-to-back years of double-digit returns in the 1940s and 1950s. The point is it’s reasonable for investors to anticipate another good year for the stock market.
Where Does Our Expected Return Come From?
Global leading indicators and a stylized “cycle-on-cycle” analysis suggest earnings growth may peak above 40% Y/Y in 4Q26. Meanwhile, the S&P 500 price-to-earnings (P/E) ratio has compressed from its recent peak of 26.4x in October 2025 to its current level of 21.5x, meaning the stock market has literally grown into its multiple which should ease the anxiety about lofty valuations. Historically, equities have performed best in periods of rising earnings, regardless of whether multiples were expanding or contracting (see slide 12).
Sector Overweights
As a group, the economy-sensitive, pro-cyclical sectors of the stock market look oversold and ripe for a bounce. We favor financials, industrials, materials, consumer discretionary (old-economy stocks), information technology and communication services (new-economy stocks) for cyclical growth and high margins in a renewed risk-on environment.
Sector Underweights
When the stock market churns and rotates, we’re thankful for the role that the defensive, counter-cyclical sectors play in the diversified portfolios that WCG manages on behalf of our advisors and their clients. While defensives have done well recently, however, they appear tactically overbought and primed for a pullback. Health care, consumer staples and utilities may continue rising but ultimately struggle to keep up with cyclicals as risk appetite improves.
If you like what you see and want more striking visuals, please check out our 2026 Market and Economic Preview or reach out to your WCG financial advisor for a copy.
Portfolio Strategy
by Jim Worden, CFA®, CMT®, CAIA®, Chief Investment Officer
November 6, 2026
The Starry Night or The Scream
Many years ago, my wife and I had the opportunity to visit the Museum of Modern Art, or MoMA, in New York City. Two displays that stood out to me on that memorable visit were The Starry Night by Vincent van Gogh and The Scream by Edvard Munch.
Both paintings seemed to elicit different emotions. One gave off relaxed and carefree vibes, while the other gave off vibes of worry, anxiety, or even fear.

As we live in a world where stress sometimes lurks, we even now have an emoji for The Scream (😱). And when we go through market turmoil, as we sometimes do, it may seem like there’s too much Scream and not enough Starry Night.
So here are a few reminders of the positives, in case we forget the Starry Night:
- Earnings continue to surprise to the upside1
- Valuations don't look terrible2
- Policy uncertainty will likely come down once the midterms are behind us
- Positive seasonality, coupled with a still-robust consumer, could see the economy and markets grind higher
- Inflation related to energy prices will come down, in our opinion
There is still money to be made for long-term, diversified investors, in our opinion. It's not without some angst and worry along the way, but we do believe it's worth it. One man's anxiety may be another man's opportunity.
Footnotes
- FactSet, Earnings Insight (October 30, 2026), p. 1: As of October 30, 60% of S&P 500 companies had reported Q3 results; among those reporters, 82% beat consensus EPS estimates and 70% beat revenue estimates. For Q4 2026, 28 of 47 companies issuing EPS guidance (59.6%, approximately 60%) issued positive guidance versus consensus, not necessarily an upward revision to their own prior guidance.
- FactSet, Earnings Insight (October 30, 2026), p. 1: The S&P 500 forward 12-month P/E ratio was 18.7, below its five-year average of 19.8 and 10-year average of 19.1. Valuation measures are not predictive of future market returns.
Definitions
S&P 500 Index: A market-capitalization-weighted index of approximately 500 leading U.S. companies.
Earnings per share (EPS): A company’s profit attributable to each outstanding common share.
Positive earnings or revenue surprise: Reported EPS or revenue above analysts’ consensus estimates; this does not necessarily indicate year-over-year growth.
Positive EPS guidance: A company’s forecast above the mean analyst EPS estimate immediately before that guidance was issued; it does not necessarily mean the company raised an earlier forecast.
Forward 12-month price-to-earnings (P/E) ratio: A valuation measure comparing an index or security’s price with estimated earnings over the next 12 months.
Seasonality: Recurring calendar-related tendencies observed in historical market performance; past patterns may not recur.
Diversification: Allocating investments among different assets or securities to reduce concentration risk; it cannot eliminate investment risk.
Inflation: An increase in the general level of prices for goods and services over time.
NBER Recession: A significant decline in economic activity spread across the economy, lasting more than a few months, as officially designated by the National Bureau of Economic Research. It is determined by analyzing factors like gross domestic product, income and employment.
Output Gap: The difference between actual economic output (Real GDP) and potential economic output (Real Potential GDP), expressed as a percentage of potential GDP. A positive gap indicates demand pressure exceeding sustainable capacity, while a negative gap reflects economic slack.
Real Potential GDP: The Congressional Budget Office's (CBO) estimate of the maximum sustainable output an economy can produce when labor and capital resources are fully employed at high utilization rates, adjusted for inflation.
Economy-Wide Capacity Utilization (CapU) Momentum: A normalized composite indicator tracking annual changes in broad industrial capacity utilization and labor market utilization. It measures whether resource take-up across the economy is accelerating, decelerating, or sitting in neutral balance.
Sticky-Price Consumer Price Index (CPI): A measure of inflation calculating price changes for goods and services that adjust relatively slowly (such as housing, medical care, and personal services). It reflects longer-term, underlying inflation expectations.
Flexible-Price Consumer Price Index (CPI): A measure of inflation tracking items whose prices adjust frequently in response to market conditions (such as energy, food, and motor fuels). It reflects immediate, short-term supply/demand shocks and geopolitical disruptions.
Core Personal Consumption Expenditures (PCE) Deflator: The Federal Reserve's preferred measure of underlying consumer inflation, excluding volatile food and energy prices, to gauge long-run price trends across the U.S. economy.
Natural Output: The theoretical level of economic output that would prevail if market prices were perfectly flexible and aggregate demand was aligned with structural potential supply. Sudden shifts in natural output caused by external disruptions are known as supply shocks.
Gross Domestic Product (GDP): The total monetary or market value of all finished goods and services produced within a country's borders during a specific period. It serves as a primary scorecard to track the overall size, activity, and health of a nation's economy.
Disclosures
The views expressed are opinions as of November 3, 2026, are subject to change without notice, and are not guarantees or predictions of future market or economic performance. Forward-looking statements concerning earnings, policy, inflation, and market direction are inherently uncertain, and actual outcomes may differ materially.
This commentary is for informational and educational purposes only and should not be construed as personalized investment advice or a recommendation to buy or sell any investment. Investing involves risk, including the possible loss of principal. Diversification does not ensure a profit or protect against loss. Historical seasonal tendencies and past performance are not guarantees of future results.
Third-party information is believed to be reliable but has not been independently verified. Earnings, guidance, and valuation figures are snapshots as of the cited dates and may subsequently change. Indexes are unmanaged and cannot be invested in directly; index returns do not reflect investment fees or expenses.
The views expressed are for informational and educational purposes only and are subject to change without notice.
This material is not intended as, and should not be interpreted as, individualized investment advice or a recommendation to buy, sell, or hold any security, sector, industry, or investment strategy.
References to specific companies, securities, sectors, or industries are for illustrative purposes only and should not be construed as investment recommendations.
Investing involves risk, including the possible loss of principal. Investments in a specific industry or sector may involve greater risk and volatility than more diversified investments.
Past performance is not indicative of future results. No investment strategy can guarantee a profit or protect against loss.
Forward-looking statements, including views about future demand, pricing, supply, or industry cycles, are based on current expectations and assumptions and are subject to risks and uncertainties. Actual results may differ materially.
Data and information are believed to be reliable, but accuracy, completeness, and timeliness are not guaranteed. Source documents should be retained for factual claims, third-party research references, and company-specific data.
Portfolio holdings, allocations, and risk budgets are subject to change based on market conditions, client objectives, and investment guidelines.
The author, firm, clients, or related persons may hold positions in securities mentioned and may buy or sell those securities without notice, subject to applicable policies and regulations.
Securities offered through LPL Financial, Member FINRA/SIPC. Investment Advice offered through WCG Wealth Advisors, LLC, an SEC Registered Investment Advisor. WCG Wealth Advisors, LLC and The Wealth Consulting Group are separate entities from LPL Financial. Index performance is shown for illustrative purposes only and does not predict or depict the performance of any investment. Past performance does not guarantee future results.
All information in this report is believed to be from reliable sources; however, WCG Wealth Advisors, LLC, makes no representation as to its completeness or accuracy.
In general, stock values fluctuate, sometimes widely, in response to activities specific to the companies as well as broad market, economic and political conditions. Stock investing involves risks, including fluctuating prices and loss of principal. Value investments can perform differently from the market as a whole. They can remain undervalued by the market for long periods of time. (135-LPL) International investing involves special risks such as currency fluctuation and political instability and may not be suitable for all investors. These risks are often heightened for investments in emerging markets. (93-LPL)
The fast price swings in commodities will result in significant volatility in an investor’s holdings. Commodities include increased risks, such as political, economic, and currency instability, and may not be suitable for all investors. (122-LPL)
Rebalancing a portfolio may cause investors to incur tax liabilities and/or transaction costs and does not assure a profit or protect against a loss. (28-LPL)
There is no guarantee that a diversified portfolio will enhance overall returns or outperform a non-diversified portfolio. Diversification does not protect against market risk. (26-LPL)
Standard deviation is a historical measure of the variability of returns relative to the average annual return. If a portfolio has a high standard deviation, its returns have been volatile. A low standard deviation indicates returns have been less volatile. (131-LPL)
This is for educational / general purposes only, does not constitute investment, tax or legal advice and should not be relied on as such. This is not to be construed as an offer to buy or sell any financial instruments. Any strategies discussed are not intended to be relied upon as the sole factor in making an investment decision for any individual. As with all investments there are associated inherent risks. Please obtain and review all financial material carefully before investing. All material presented is compiled from sources believed to be reliable and current, but accuracy cannot be guaranteed. The opinions voiced in this material are for general information only and are not intended to provide specific advice or recommendations for any individual. All performance referenced is historical and is no guarantee of future results. All indices are unmanaged and may not be invested in directly. These comments should not be construed as recommendations but as an illustration of broader themes.
Forward-looking statements are not guarantees of future results. They involve risks, uncertainties and assumptions; there can be no assurance that actual results will not differ materially from expectations. In addition, forward-looking statements, including index targets or market scenarios, are hypothetical in nature, reflect current views and assumptions and are subject to change based on market and economic conditions and are not guarantees of future performance. This is a hypothetical example and is not representative of any specific investment. Your results may vary. (88-LPL) Scenario outcomes are illustrative and not predictive. This does not constitute a recommendation of any investment strategy or product for a particular investor. Investors should consult a financial professional before making any investment decisions.
The S&P 500 is a stock market index tracking the stock performance of 500 of the largest companies listed on stock exchanges in the United States. Indexes are unmanaged and cannot be invested in directly. (102-LPL)
Government bonds and Treasury bills are guaranteed by the US government as to the timely payment of principal and interest and, if held to maturity, offer a fixed rate of return and fixed principal value.
Publication Date: November 6, 2026
For Public Use in the US
The Wealth Consulting Group
LPL 1203905