


Market Strategy
by Talley Leger, Chief Market Strategist
November 13, 2026
Semi Stock Risk/Reward: Not for the Faint of Heart
Last week, the surprising “blue-nami” election outcome and washout in the semiconductor industry priced related stocks for “Armageddon,” meaning investors discounted an unprecedented amount of bad news in semi stocks. However, super-cyclical areas of the equity market are known for such extreme over and under reactions. The upshot is that expectations are now so low that even a small amount of good news could catalyze a positive reversion to the mean in semi share prices, but the timing is fraught with risk.
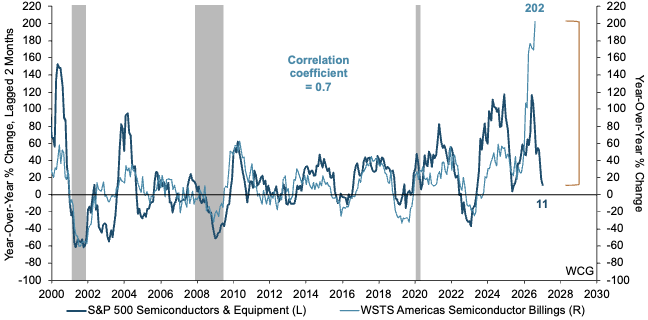
Semi Stocks Lead Semi Billings: Generally, stock prices are forward-looking discounting mechanisms or “leading” indicators, whereas fundamentals such as billings and revenues are “lagging” indicators. Specifically, semi stocks lead semi billings by a couple of months because the former are real-time financial market variables while the latter are physical shipments and fulfilled purchase orders from 1-2 quarters prior (see the chart below):
- Billings = Shipments: According to the World Semiconductor Trade Statistics (WSTS), a billing is recorded when a semiconductor is boxed, shipped and invoiced. Simply put, it’s a “point-in-time” snapshot of hardware leaving the factory floor in that specific month or quarter.
- Lead-Time Gap: The lag between customers placing purchase orders and recorded billings is dictated by the chip industry’s standard manufacturing cycle. Typically, lead times run between 3-6 months (or 1 to 2 quarters).
- “Rubber Band” Effect: During extreme supply chain shortages (e.g., 2021-2022), lead times can extend to 3-4 quarters, meaning current billings could reflect older orders. By contrast, lead times can shorten to less than 1 quarter in a downturn or supply overhang.
From “Irrational Exuberance” in May to “Unprecedented Divergence” in November
Sources: YCharts, WCG, 11/6/26. Notes: Vertical gray bands = US economic recessions. WSTS = World Semiconductor Trade Statistics. Indices are unmanaged and cannot be invested in directly. Past performance is no guarantee of future results.
“Peak” Billings Growth: According to WSTS, semiconductor billings in the Americas grew 202% year over year (Y/Y) in August, reflecting potential “peak” fulfillment of massive artificial intelligence (AI) accelerator backlogs. When semi stocks collapse while billings remain elevated, market participants are anticipating rapid revenue deceleration, customer inventory digestion and / or a “hyperscaler” capital expenditure (capex) “cliff” over the next 1-3 months.
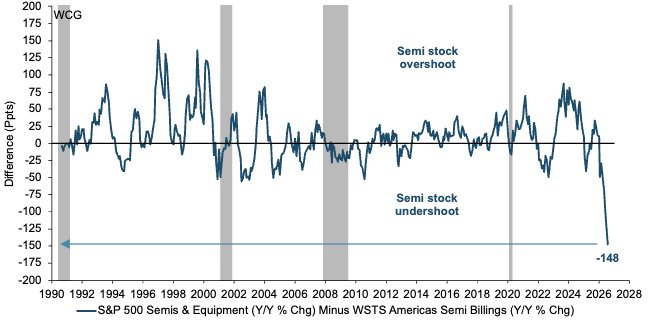
To be clear, the unprecedented divergence between semi stocks and billings began in April / May – when we rotated into software stocks – and widened after the election, as investors feared a “doomsday” deceleration in topline industry growth and / or margin compression (see the chart below).
The Biggest Semi Stock Undershoot Relative to Semi Billings in Recorded History!
Sources: YCharts, WCG, 11/6/26. Notes: Indices are unmanaged and cannot be invested in directly. Past performance is no guarantee of future results.
“Armageddon” Argument
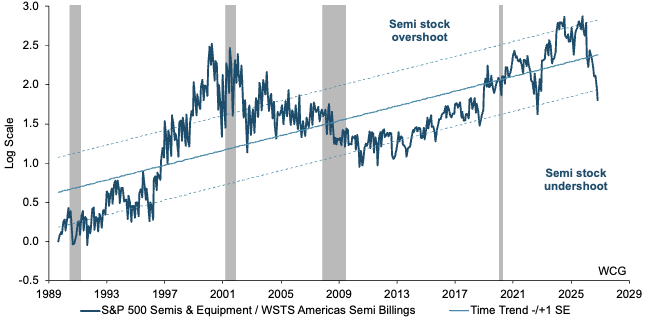
- Asymmetric Risk/Reward: For practitioners, a log-linear regression against time is a helpful heuristic for visualizing secular trends in the semi stock-to-billings ratio. When semi stocks decouple below -1 standard error (SE) from trailing billings, the consensus narrative is overwhelmingly bearish. At these depressed levels, investors aren’t just pricing in a normal cyclical slowdown. Rather, they’re discounting a severe, imminent collapse in orders and abrupt cancellations, which may be contractually impossible.
- Low Hurdle < Positive Surprises: Because expectations have been beaten down so low, so fast, the fundamentals don’t necessarily need to be good for the stocks to rally. Shipments merely need to be less terrible than the current “catastrophe” scenario implies. Stabilizing lead times, order delays that prove shorter than feared or even in-line guidance could serve as tactical catalysts for a short-covering rally and mean-reversion trades (see the chart below).
Asymmetrical Undershoot
- Notorious Reflexivity: Information technology and semiconductor cycles are notorious for reflexivity and massive over/undershoots in both directions.
o In 2024-2025, the semiconductor industry overshot the +1 SE, as AI exuberance decoupled significantly from physical shipments.
o The current drawdown is a classic mirror image: A panicked margin call and liquidation phase that throws the proverbial baby out with the bathwater, driving the semi stock-to-billings ratio below -1 SE.
Historically, Semi Stocks Were a “Buy” When Share Prices Deviated Far Below Fundamentals
Sources: YCharts, WCG, 11/6/26. Notes: SE = Standard error. Indices are unmanaged and cannot be invested in directly. Past performance is no guarantee of future results.
Investor sentiment and market pricing have completely detached from fundamentals. When a liquid, high-velocity, super-cyclical group of stocks experiences the largest short-term undershoot relative to revenues in recorded history, pushing the semi stock-to-billings ratio below its historic time trend channel, it creates an asynchronous entry point for aggressive, tactical allocators. While additional bad news and downside are always possible, positive revenue surprises – however modest – may spark the interest of courageous speculators willing to test the asymmetrical risk/reward payout in semi stocks.
Semi Stocks: Twice the Risk, Twice the Reward?
Sources: YCharts, WCG, 11/6/26. Notes: CAGR = Compound annual growth rate. Indices are unmanaged and cannot be invested in directly. Past performance is no guarantee of future results.
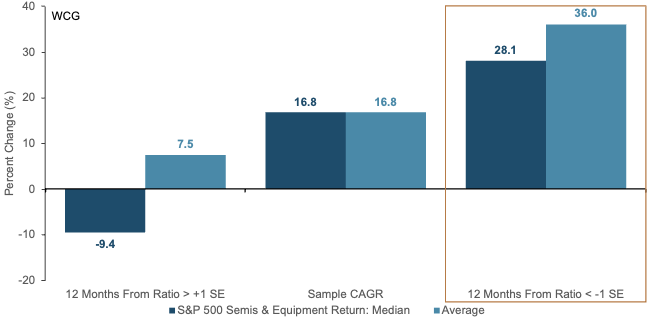
To evaluate whether the extremely negative divergence between semi stocks and their fundamentals represents a compelling entry point, I conducted a historical event study. Specifically, I calculated 12-month forward price returns on the S&P 500 Semiconductors & Semiconductor Equipment Index across three distinct regimes based on a log-linear regression of the semi stock-to-billings ratio against time:
- “Upper Band” Regime (> +1 SE): Periods of extreme valuation expansion and exuberant sentiment (e.g., 2000 “Dot.com” bubble, 2024-2025 AI mania).
- Full Sample Baseline: The historical long-term average return across all regimes from 1989 to 2026.
- “Lower Band” Regime (< -1 SE): Periods of severe undershoots and capitulation (e.g., 1990, 2010-2015, 2018, 2022).
Double-Digit Gains from the “Lower Band” (< -1 SE)
- Superior Return Profile: When the semi stock-to-billings ratio drops below -1 SE, the average 12-month forward return (36.0%) more than doubles the full-sample average return (16.8%).
- Post-Entry Risk Mitigation: Because “Armageddon” is already reflected in share prices (-29.9% since June 2, 2026), the maximum drawdown experienced after establishing a position at these extreme lows could be comparatively compressed, as a substantial portion of the liquidation wave may have already run its course.
Sub-Par Returns and / or Losses from the “Upper Band” ( > +1 SE)
- Inferior Return Profile: When the semi stock-to-billings ratio rises above +1 SE, the average 12-month subsequent return degrades meaningfully to a meager 7.5%, less than half the full-sample average return of 16.8%.
Stretched valuation leaves little margin for error, which validates why taking profits in manias (read: “sell” discipline) is as critical as taking risks in panics (read: “buy” discipline).
Bottom Line
The empirical evidence suggests that the “bloodbath” and record undershoot in semi stocks is more of a market dislocation than a fundamental breakdown. While not for the faint of heart, re-engaging semiconductor equities at “bargain basement” prices aligns with asymmetrical buying opportunities where the prospective risk/reward profile likely favors selective accumulation.
Portfolio Strategy
by Jim Worden, CFA®, CMT®, CAIA®, Chief Investment Officer
November 13, 2026
Idiosyncratic Risk
I’ve been in the business long enough to accumulate some scar tissue along the way. Some of these scars were innocent mistakes that I believe I learned from, but the markets are like a mentor that keeps mentoring us. There’s always more to be learned. Some of the scars were from things that were unpredictable and out of one’s control. These include the tech bubble and the subsequent bursting of it, the Global Financial Crisis and related housing market collapse, and the pandemic. There have also been wars, terrorist attacks, taper tantrums, tariff tantrums, runaway inflation, European debt crises, Brexit, election surprises, and many other events. None of these events can be controlled by investors, though we may have an opinion on them and we may even be cautious with how we build a portfolio due to potential risks.
I would argue the one area that can be mitigated or controlled even better than these events is idiosyncratic risk. It’s the risk of having too much exposure to one or more companies. Many active managers have large exposures to this type of risk, but it cuts both ways. One company could be up 1,000% and another company could fail to get FDA approval on a drug and drop 50% or more in one day. Concentrated bets can also take over a portfolio, if they are not rebalanced. Idiosyncratic comes from the Greek root word idios, meaning “one’s own, private, personal, peculiar to oneself.” The word idiot is also related. Idiotes, to the Greeks, was a lay person as opposed to an expert.1
While no one could have predicted what would happen with Enron or WorldCom, investors who didn’t have large concentration or idiosyncratic risk were harmed less than those who had larger weights. Of course, this risk isn’t just limited to fraud. Past leaders from Boeing, BP, HP, Intel, McDonald’s, Wynn Resorts, Papa John’s, Wells Fargo, Uber, and many more have resigned or were pushed out due to personal conduct or poor decision-making.
That brings us to today, where much of the news is around Jensen Huang, who resigned after 33 years as co-founder and CEO of NVIDIA due to his extramarital affair with an alleged Chinese spy. It’s a clear reminder that even some of the smartest and most successful people do stupid things. In a 2018 CNBC interview, Warren Buffett quoted Charlie Munger as saying, “there [are] only three ways a smart person can go broke: liquor, ladies, and leverage.” While Buffett and Munger were likely focusing on leverage as the main culprit, there have been plenty of successful people who made some bad choices around their personal conduct, and it has been devastating for them and for the companies they managed.2,3
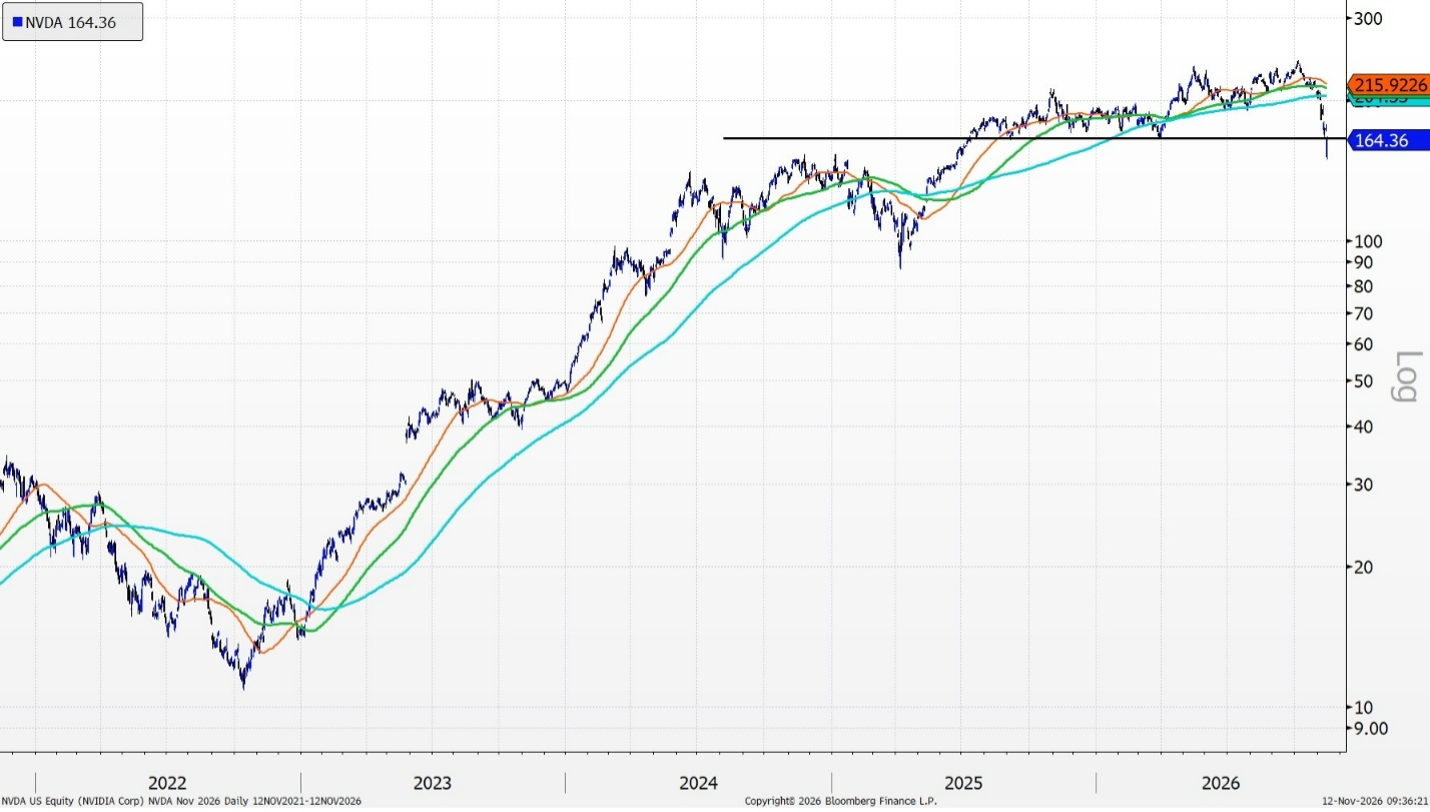
NVIDIA Stock Price (11/12/21 through 11/12/26 at approximately 9:30 a.m. PT, Bloomberg)
So what are investors to do? I have said for a long time publicly that I love NVDA stock, but I don’t love it at 6% or 8% of a portfolio. I have loved it at 2%–2.5% and with the current valuation at just under 18x next year’s estimated earnings and technicals finding some support at current levels, I may still love it at 2%–2.5%. To be clear, I also love AMD, AVGO, INTC, MU, LRCX, ASML, and TSM, also at manageable weights.4
With the change in leadership and a potential new vision at NVDA, the question that is on some investors’ minds may be: Should I still own it? That’s a personal question and it will come down to how much concentration investors have with it and whether they have faith in the new leadership. Taxes are another consideration. For someone who never owned it, this is very attractively priced and still has some growth left, in my opinion. I believe some are also wondering or doubting if it can continue to grow the way it has. One need only look at a company like Apple to see that growth beyond the original founder is still possible. While many love to look at what Steve Jobs did for Apple, some might forget that under Tim Cook, Apple’s stock grew by a whopping 2,300% during his tenure. That’s nearly 24% a year annualized from August of 2011.5
I would also zoom out and look at one’s entire portfolio as a whole. Are there certain factors, sectors, or styles where risk is too concentrated? Remember, it’s not about the number of names, but the amount of exposure. One manager may have three dozen tech names in a portfolio and may still be underweight technology relative to the S&P 500. Another manager may have just four names and may be significantly overweight. That last manager may also be taking on too much idiosyncratic risk for multiple companies.
I know this may sound like a broken record, but diversification and risk management are still hallmarks of a sound investment strategy, in my opinion. If we don’t want to feel like an idiot, we would be wise to be aware of large idiosyncratic risks. And for CEOs or anyone in a leadership position, it’s good to remember the admonition of Charlie Munger— liquor, ladies, and leverage.
Footnotes
- Online Etymology Dictionary, “idiot,” https://www.etymonline.com/word/idiot (accessed November 12, 2026). Greek idiōtēs denotes a private person or layperson.
- CNBC, “The three ‘L’ ways a smart person can go broke,” Warren Buffett interview, February 26, 2018, https://buffett.cnbc.com/video/2018/02/26/buffett-lists-mungers-three-l-ways-a-smart-person-can-go-broke.html.
- NVIDIA, “NVIDIA Announces CEO Transition,” November 12, 2026, https://nvidianews.nvidia.com/_gallery/download_pdf/6af5c3cc3d6332f541088655/; Associated Press, November 12, 2026, https://apnews.com/article/5403f152a601cf82ce939f1d24fffa0f. The reported intelligence connection remains alleged.
- Source: Bloomberg Terminal, forward price-to-earnings ratio for NVDA, as of November 12, 2026. The author reports a multiple just under 18× next year’s estimated earnings.
- Source: Bloomberg Terminal, Apple Inc. share-price appreciation of 2,320.02% from August 24, 2011, through September 1, 2026, as reported by the author. Figure refers to price appreciation, not necessarily total return.
Definitions
NBER Recession: A significant decline in economic activity spread across the economy, lasting more than a few months, as officially designated by the National Bureau of Economic Research. It is determined by analyzing factors like gross domestic product, income and employment.
WSTS Americas Semiconductor Billings: The primary industry benchmark published by World Semiconductor Trade Statistics, capturing actual invoiced shipments of semiconductor devices across the Americas. It serves as a lagging indicator of physical hardware moving off factory floors.
S&P 500 Semiconductors & Semiconductor Equipment Index: A capitalization-weighted equity benchmark tracking U.S. leaders across semiconductor design, manufacturing, and wafer fabrication equipment (WFE).
Stock-to-Billings Log Ratio: The natural logarithm of the ratio between the S&P 500 Semiconductors Index and WSTS Americas Billings [ln(Semi Stocks/Billings)], used to linearize exponential secular growth and normalize cyclical divergence.
Regression Standard Error (SE) Bands: Statistical boundaries (-/+1 SE) derived from the log-linear time trend. They quantify historical deviations, where values below -1 SE represent extreme capitulation and fundamental undershoots.
Reflexivity & Over/Undershoot: Market dynamics wherein investor sentiment and high-beta asset prices detach from physical fundamentals, leading to self-reinforcing expansions (overshoots above +1 SE) and liquidation panics (undershoots below -1 SE).
Idiosyncratic risk: Risk specific to an individual company or security, as distinct from broad market risk.
Concentration risk: The risk of outsized portfolio losses from significant exposure to a security, sector, or common risk factor.
Diversification: Allocating investments across different securities or exposures to reduce concentration; it does not eliminate the risk of loss.
Forward price-to-earnings (P/E) ratio: A stock’s price divided by expected earnings per share for a specified future period; estimates may change.
Technical analysis: Evaluation of price, volume, and market trends to identify possible market behavior; results are not assured.
FDA: U.S. Food and Drug Administration. S&P 500: A market-capitalization-weighted index of large U.S. companies.
NVDA (NVIDIA), AMD (Advanced Micro Devices), AVGO (Broadcom), INTC (Intel), MU (Micron Technology), LRCX (Lam Research), ASML (ASML Holding), and TSM (Taiwan Semiconductor Manufacturing): Stock ticker symbols referenced in this commentary.
Disclosures
This material represents the author’s opinions as of November 12, 2026, and is intended for informational purposes only. Opinions may change without notice and should not be construed as personalized investment advice or a recommendation to buy, sell, or hold any security.
Investing involves risk, including possible loss of principal. Diversification and risk management do not guarantee a profit or protect against loss in declining markets. Individual security positions and appropriate weights depend on an investor’s objectives, risk tolerance, time horizon, and circumstances.
Past performance is not indicative of future results. Historical stock price changes do not necessarily represent total returns and may exclude dividends. Forecast earnings and valuation multiples are estimates, not guarantees. Bloomberg terminal data are presented as of the dates stated; valuation estimates and historical price appreciation depend on the selected data fields and calculation methodology.
Securities discussed may be held in portfolios managed by the author or affiliated firms. Any applicable firm-specific holdings, conflicts-of-interest, and regulatory disclosures should be added or confirmed by compliance before distribution.
The views expressed are for informational and educational purposes only and are subject to change without notice.
This material is not intended as, and should not be interpreted as, individualized investment advice or a recommendation to buy, sell, or hold any security, sector, industry, or investment strategy.
References to specific companies, securities, sectors, or industries are for illustrative purposes only and should not be construed as investment recommendations.
Investing involves risk, including the possible loss of principal. Investments in a specific industry or sector may involve greater risk and volatility than more diversified investments.
Past performance is not indicative of future results. No investment strategy can guarantee a profit or protect against loss.
Forward-looking statements, including views about future demand, pricing, supply, or industry cycles, are based on current expectations and assumptions and are subject to risks and uncertainties. Actual results may differ materially.
Data and information are believed to be reliable, but accuracy, completeness, and timeliness are not guaranteed. Source documents should be retained for factual claims, third-party research references, and company-specific data.
Portfolio holdings, allocations, and risk budgets are subject to change based on market conditions, client objectives, and investment guidelines.
The author, firm, clients, or related persons may hold positions in securities mentioned and may buy or sell those securities without notice, subject to applicable policies and regulations.
Securities offered through LPL Financial, Member FINRA/SIPC. Investment Advice offered through WCG Wealth Advisors, LLC, an SEC Registered Investment Advisor. WCG Wealth Advisors, LLC and The Wealth Consulting Group are separate entities from LPL Financial. Index performance is shown for illustrative purposes only and does not predict or depict the performance of any investment. Past performance does not guarantee future results.
All information in this report is believed to be from reliable sources; however, WCG Wealth Advisors, LLC, makes no representation as to its completeness or accuracy.
In general, stock values fluctuate, sometimes widely, in response to activities specific to the companies as well as broad market, economic and political conditions. Stock investing involves risks, including fluctuating prices and loss of principal. Value investments can perform differently from the market as a whole. They can remain undervalued by the market for long periods of time. (135-LPL) International investing involves special risks such as currency fluctuation and political instability and may not be suitable for all investors. These risks are often heightened for investments in emerging markets. (93-LPL)
The fast price swings in commodities will result in significant volatility in an investor’s holdings. Commodities include increased risks, such as political, economic, and currency instability, and may not be suitable for all investors. (122-LPL)
Rebalancing a portfolio may cause investors to incur tax liabilities and/or transaction costs and does not assure a profit or protect against a loss. (28-LPL)
There is no guarantee that a diversified portfolio will enhance overall returns or outperform a non-diversified portfolio. Diversification does not protect against market risk. (26-LPL)
Standard deviation is a historical measure of the variability of returns relative to the average annual return. If a portfolio has a high standard deviation, its returns have been volatile. A low standard deviation indicates returns have been less volatile. (131-LPL)
This is for educational / general purposes only, does not constitute investment, tax or legal advice and should not be relied on as such. This is not to be construed as an offer to buy or sell any financial instruments. Any strategies discussed are not intended to be relied upon as the sole factor in making an investment decision for any individual. As with all investments there are associated inherent risks. Please obtain and review all financial material carefully before investing. All material presented is compiled from sources believed to be reliable and current, but accuracy cannot be guaranteed. The opinions voiced in this material are for general information only and are not intended to provide specific advice or recommendations for any individual. All performance referenced is historical and is no guarantee of future results. All indices are unmanaged and may not be invested in directly. These comments should not be construed as recommendations but as an illustration of broader themes.
Forward-looking statements are not guarantees of future results. They involve risks, uncertainties and assumptions; there can be no assurance that actual results will not differ materially from expectations. In addition, forward-looking statements, including index targets or market scenarios, are hypothetical in nature, reflect current views and assumptions and are subject to change based on market and economic conditions and are not guarantees of future performance. This is a hypothetical example and is not representative of any specific investment. Your results may vary. (88-LPL) Scenario outcomes are illustrative and not predictive. This does not constitute a recommendation of any investment strategy or product for a particular investor. Investors should consult a financial professional before making any investment decisions.
The S&P 500 is a stock market index tracking the stock performance of 500 of the largest companies listed on stock exchanges in the United States. Indexes are unmanaged and cannot be invested in directly. (102-LPL)
Government bonds and Treasury bills are guaranteed by the US government as to the timely payment of principal and interest and, if held to maturity, offer a fixed rate of return and fixed principal value.
Publication Date: November 13, 2026
For Public Use in the US
The Wealth Consulting Group
LPL1208879