


The Weekly Wealth Watch
September 28, 2026
The Markets
“The availability of massive amounts of data and cutting-edge technology only magnifies the power of a scientific approach.” — David Siegel, Co-Founder & Co-Chairman, Two Sigma
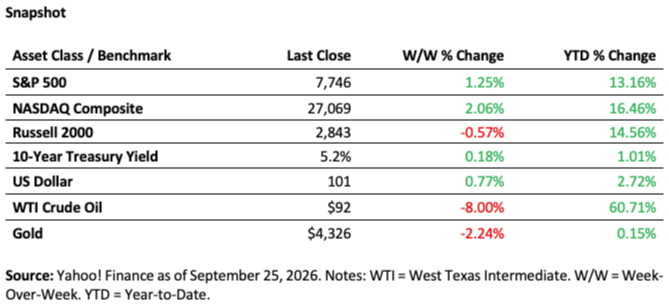
U.S. equity markets finished the week mostly higher, led by technology shares. The S&P 500 advanced +1.25%, bringing its year-to-date gain to +13.16%. The NASDAQ Composite climbed +2.06%, extending its year-to-date return to +16.46%. Small-cap stocks moved in the opposite direction, with the Russell 2000 declining –0.57% for the week, though it remains up +14.56% year-to-date.
In fixed income, the 10-Year Treasury yield increased +0.18%, finishing the week at 5.2%. The move continued the recent rise in longer-term yields, leaving the 10-year Treasury yield up +1.01% year-to-date.
The U.S. dollar strengthened +0.77% during the week, bringing its year-to-date gain to +2.72%.
Commodities moved sharply lower. WTI crude oil declined –8.00%, finishing the week at $92 per barrel, though it remains up +60.71% year-to-date. Gold fell –2.24%, finishing at $4,326, leaving the precious metal modestly positive at +0.15% year-to-date.
Overall, the week highlighted a notable divergence across markets. Large-cap equities—particularly technology—continued to advance even as small caps declined, Treasury yields moved higher, and commodities retreated. Despite these crosscurrents, all three equity benchmarks in the snapshot remain firmly positive for the year, with the NASDAQ continuing to lead at +16.46%.
David Siegel's philosophy at Two Sigma provides a fitting perspective for an environment where traditional market relationships may not always tell the entire story. Two Sigma was built around applying technology, data, and scientific rigor to complex investment problems; Siegel has argued that hard investment problems benefit from carefully formed hypotheses followed by continual measurement, learning, and adjustment. Two Sigma In a market where technology is evolving rapidly and different asset classes are sending conflicting signals, discipline and evidence can be more useful than assuming the past will repeat itself exactly.
The Limits of Looking Backward
“The investor of today does not profit from yesterday’s growth” — Warren Buffett
Investing has always relied heavily on history.
We study previous recessions, market cycles, valuation multiples, interest-rate environments, bubbles, crashes, and recoveries because the past gives us a framework for understanding what might happen next.
There is good reason for that.
Human behavior has proven remarkably persistent. Fear and greed existed 100 years ago, and they exist today. Investors still chase returns. Markets still become overly optimistic and overly pessimistic. Bubbles still form, and eventually expectations collide with reality.
But the Weekly Input raises a more difficult question:
What happens when the variables themselves begin changing faster than our historical models can accommodate?
Finance is not physics. Markets are influenced by human behavior, expectations, narratives, policy, technology, and countless other factors. Two identical economic environments can produce very different market outcomes because the people participating in those markets may react differently.
Traditional financial analysis remains extremely useful. Discounted cash flows, long-term growth rates, dividends, relative valuations, debt levels, technical analysis, and market cycles all help investors organize information and think systematically.
But models are ultimately representations of reality—not reality itself.
The Weekly Input makes an important distinction around the famous phrase “this time is different.”
Investors are right to be skeptical whenever they hear it. History is filled with examples of people using those four words to justify excessive valuations, speculative behavior, or the belief that traditional risks no longer matter.
Yet automatically assuming that nothing is different can create another problem.
Markets themselves haven't fundamentally changed overnight. People still buy and sell securities. Companies still generate revenue and profits. Investors still respond emotionally to gains and losses.
But technology may be changing how quickly companies can grow, reduce costs, gain market share, and disrupt competitors.
That distinction matters.
The past can provide context.
It can teach us about human behavior.
It can remind us how markets have reacted to previous periods of disruption.
But history is a guide—not a blueprint.
As investors, perhaps the goal isn't to stop looking backward.
It is to recognize when the rearview mirror may no longer show us everything approaching from the road ahead.
The Old Playbook: Useful, but Not Universal
“History doesn’t repeat itself, but it often rhymes.” — Commonly attributed to Mark Twain
Investors have an enormous playbook built from decades of market history.
We know how equities have historically behaved during recessions. We study valuation ratios, earnings cycles, inflation, interest rates, credit conditions, market breadth, technical patterns, and investor sentiment.
That playbook remains useful.
The Weekly Input points out that despite enormous changes in technology, markets themselves have not fundamentally transformed over the decades. More people participate through 401(k)s, online trading has expanded access, transaction costs have fallen, and investors have many more securities and instruments available to them. But human beings remain the participants behind those markets.
That's why history still matters.
But useful doesn't mean universal.
A historical analogy works best when the variables being compared are reasonably similar.
When technology changes a company's economics dramatically, those comparisons become more difficult.
Imagine two identical businesses. Both grow revenue 5%, carry similar debt, have similar operating leverage, and pay similar dividends.
Then one discovers technology allowing it to reduce costs by 30% while increasing revenue by 15% without adding employees.
The other continues operating exactly as before.
Initially, the businesses looked identical.
A few years later, they may barely resemble each other. One could be compounding revenue, margins, earnings, and market share while the other struggles to keep pace.
The old playbook isn't wrong.
It simply may not contain every new play.
The New Variable: Disruption at Exponential Speed
“We always overestimate the change that will occur in the next two years and underestimate the change that will occur in the next ten.” — Bill Gates
Growth has always been difficult to forecast.
But technological disruption can make the problem considerably harder.
The Weekly Input asks investors to consider not only the companies adopting new technology, but also the companies selling technology capable of increasing revenue and reducing costs for thousands of other businesses.
How should those companies be valued?
Traditional analysis might assume rapid growth followed by an eventual slowdown. Analysts can incorporate competition, economic cycles, policy changes, and other assumptions.
But every additional assumption expands the range of potential outcomes.
Eventually, the forecast can become so wide that even predicting the direction of change becomes difficult.
AI magnifies this problem.
Software can spread rapidly. New capabilities can reach millions of users quickly. A breakthrough at one company can suddenly affect businesses across industries that previously appeared unrelated to technology.
Retail. Healthcare. Finance. Manufacturing. Transportation. Advertising. Energy.
The list keeps expanding.
For investors, that means disruption itself may increasingly become an important variable.
The challenge isn't merely identifying which technology wins.
It's understanding who benefits, who gets disrupted, how quickly adoption occurs, how much companies are willing to spend, and how long extraordinary growth can continue.
Those questions don't fit neatly into a historical spreadsheet.
Sometimes the most consequential variable is the one that wasn't present in the previous cycle.
AI: Bubble or Boom? Or Both?
“Price is what you pay. Value is what you get.”— Warren Buffett
Is artificial intelligence a bubble?
Or are we witnessing the beginning of one of the largest technology investment cycles in modern history?
Perhaps those possibilities aren't mutually exclusive.
The Weekly Input describes an unusually wide range of expectations surrounding AI. Some observers have been calling it a massive bubble. Others believe the industry may have another decade of extraordinary growth ahead, with little sign of demand slowing.
That gap matters.
Markets prefer certainty. Analysts generally feel more comfortable forecasting within relatively narrow ranges.
AI provides the opposite.
Growth assumptions vary enormously. Capital spending is substantial. New competitors are emerging. Technologies are improving rapidly. Entire industries are trying to determine whether AI will lower costs, increase revenue, threaten existing business models—or accomplish all three.
That uncertainty can produce dramatic market reactions.
One day, a new application appears capable of disrupting an established industry and stocks surge.
Another day, a CEO issues a warning about technology or demand and sentiment reverses.
The result may be periods when markets “scream higher” and then fall sharply—sometimes within the same week, as described in the Weekly Input.
History also tells us that transformative technologies and speculative excess can coexist.
A technology can ultimately change the world while investors simultaneously become overly enthusiastic about certain companies associated with it.
So perhaps investors don't need to choose immediately between bubble and boom.
The more important task is distinguishing technological potential from the price being paid for that potential.
The Distorted Mirror Problem
“It ain’t what you don’t know that gets you into trouble. It’s what you know for sure that just ain’t so.”— Commonly attributed to Mark Twain
Imagine walking through a carnival fun house filled with distorted mirrors.
One mirror makes you look taller.
Another makes you look wider.
Another bends your reflection so dramatically that you barely recognize yourself.
The Weekly Input uses this image as a metaphor for one of investing's greatest challenges: sometimes the information we're looking at is real, but the reflection we draw from it is distorted.
Historical comparisons can work the same way.
We may look at a previous technology boom and assume today's AI cycle should behave similarly.
We may compare valuations, growth rates, interest rates, or market cycles and conclude that because two periods appear similar, the outcome should also be similar.
But the underlying conditions may be different.
The Weekly Input offers another analogy: a balloon and a feather are both subject to gravity, yet they won't necessarily fall identically because other variables—such as air resistance and their physical characteristics—matter too.
Markets are similar.
The fundamental laws of investing haven't disappeared.
Cash flows matter.
Valuations matter.
Competition matters.
Human behavior matters.
But technology, information flow, market structure, and the speed of disruption can change the environment in which those principles operate.
The danger isn't looking at history.
The danger is assuming the reflection history gives us is perfectly clear.
So What Do We Do When We Know We Don't Know?
“The essence of investment management is the management of risks, not the management of returns.”— Benjamin Graham
There is something uncomfortable—but useful—about admitting:
We don't know.
We don't know exactly how large AI will become.
We don't know which companies will ultimately dominate.
We don't know whether today's extraordinary capital spending will produce extraordinary future profits.
And we don't know whether historical market relationships will work exactly as they have before.
That uncertainty isn't a reason to stop investing.
It is a reason to remember the fundamentals of portfolio construction.
The Weekly Input ends with two particularly important concepts: diversification and risk management.
Diversification acknowledges that our forecasts may be wrong.
Risk management acknowledges that even our highest-conviction ideas contain uncertainty.
Neither eliminates losses. Neither guarantees success.
But both reduce the need to make one perfect prediction about an inherently unpredictable future.
That may be particularly valuable during periods of rapid technological change.
Investors don't necessarily need to know exactly where AI will be in five or ten years.
They need portfolios capable of surviving multiple possible outcomes.
And perhaps the most useful disclosure in finance remains the simplest:
“Past performance is not indicative of future results.”
Fun Facts & Figures
When the Old Math Meets a New World
“It is better to be roughly right than precisely wrong.”— Commonly attributed to John Maynard Keynes
📊 5% Starting Growth — The Weekly Input's hypothetical example begins with two otherwise similar companies each growing revenue at 5%.
⚙️ –30% Costs — One hypothetical company adopts technology capable of reducing its costs by 30%.
🚀 +15% Revenue — The same technology simultaneously increases the company's revenue by 15% in the illustration.
👥 Zero Additional Headcount — Even more strikingly, the hypothetical improvement occurs without increasing the company's number of employees.
🧮 More Assumptions = Wider Outcomes — Forecasting exponential technology growth requires assumptions about adoption, competition, economic cycles, policy, and eventual slowing. The Weekly Input notes that as assumptions multiply, potential outcomes become increasingly wide.
🤖 10 More Years? — Some observers believe AI represents a bubble, while others envision roughly another decade of major growth. The Weekly Input presents these as examples of the unusually wide range of expectations—not as forecasts.
🪞 The Distorted Mirror — Historical information may be accurate while still producing a misleading comparison if today's underlying variables are materially different.
🛡️ When Forecasting Gets Harder, Diversification Matters More — The Weekly Input's conclusion isn't to abandon history or forecasting. It is to remember diversification and risk management when uncertainty is unusually high.
On This Day in History — September 28
“The farther backward you can look, the farther forward you are likely to see” — Winston Churchill
1928 — Alexander Fleming Notices Something Extraordinary
On September 28, 1928, Scottish scientist Alexander Fleming famously observed the antibacterial effects of mold growing in a laboratory culture—an observation that eventually contributed to the development of penicillin.
It is an especially appropriate historical milestone for this week's theme.
Breakthroughs don't always arrive according to a model. Sometimes an unexpected observation changes what humanity believes is possible.
Penicillin ultimately transformed medicine, but recognizing an important discovery and turning it into something useful at scale were two very different challenges.
AI may offer a similar investing lesson.
Identifying a transformational technology is only the beginning. Understanding its commercial impact, adoption rate, competitive landscape, winners, losers, and ultimate economic value is much harder.
Other September 28 Milestones
🌎 1542 — Juan Rodríguez Cabrillo Reaches San Diego Bay: His expedition became the first recorded European expedition to reach what is now the west coast of the United States.
⚔️ 1781 — The Siege of Yorktown Begins: American and French forces began the decisive operation that would culminate in the British surrender during the American Revolutionary War.
🔬 1928 — Fleming's Penicillin Observation: An unexpected laboratory observation ultimately helped open the antibiotic era.
📺 1951 — Color Television Takes an Early Step Forward: CBS began commercial color television broadcasts, part of the long technological evolution that transformed mass communication.
🚀 2008 — SpaceX's Falcon 1 Reaches Orbit: Falcon 1 became the first privately developed liquid-fueled rocket to reach Earth orbit—a major milestone for commercial spaceflight.
Technology repeatedly teaches the same lesson:
The future rarely develops exactly according to the old playbook.
Sometimes yesterday's knowledge helps us understand tomorrow.
Other times, something genuinely new changes the rules.
“Discovery consists of seeing what everybody has seen and thinking what nobody has thought.” — Albert Szent-Györgyi
Sources & Footnotes:
- Weekly Input — “Using the Past to Predict the Future.” Primary source for this week's discussion of finance as a social science, investor behavior, historical market comparisons, technological disruption, AI, diversification, and risk management.
- Weekly Input — Traditional Financial Analysis. The Weekly Input discusses present and future values, discounted cash flows, long-term growth rates, dividends, relative price ratios, debt, technical analysis, factors, styles, and historical market environments as traditional tools for understanding securities and markets.
- Weekly Input — “This Time Is Different.” The Weekly Input argues that automatically rejecting the phrase remains healthy, while investors should still consider what genuinely may be different. Human behavior and bubbles may remain familiar, while information access, securities, transaction costs, participation, and technology continue evolving.
- Weekly Input — Hypothetical Technology Adoption Example. The two-company example—including 5% initial revenue growth, a 30% cost reduction, and a 15% revenue increase without additional headcount—is hypothetical and is intended to demonstrate how technological adoption could cause otherwise similar companies to diverge substantially over time.
- Weekly Input — Valuing Disruptive Technology. Forecasting businesses selling transformative technology requires assumptions regarding exponential growth, competition, economic cycles, policy cycles, and other variables. Increasing the number of assumptions can significantly widen the range of possible outcomes and reduce forecasting precision.
- Weekly Input — AI: Bubble or Long-Term Growth? The Weekly Input describes widely differing views surrounding AI, ranging from concerns about a major bubble to expectations for another decade of substantial growth. These perspectives illustrate uncertainty and are not presented as guaranteed outcomes.
- Weekly Input — The Distorted Mirror Analogy. Historical market characteristics can sometimes provide useful guidance, but changes in underlying conditions may make past comparisons less reliable. The Weekly Input compares this challenge to examining oneself in distorted fun-house mirrors and to expecting a balloon and feather to behave identically simply because both are subject to gravity.
- Weekly Input — Diversification and Risk Management. When investors recognize the limits of their forecasts, the Weekly Input emphasizes the continued importance of diversification and risk management while reminding readers that past performance is not indicative of future results.
- Weekly Input — Definitions. Technical analysis, discounted cash flow, enterprise value, operating leverage, top-line growth, market bubbles, market cycles, diversification, and risk management are defined for educational purposes in the Weekly Input.
- Historical References — September 28. Historical milestones referenced in the “On This Day in History” section include Alexander Fleming's 1928 observation leading toward penicillin, the Siege of Yorktown, early color television, and SpaceX Falcon 1's successful orbital flight. These historical references are supplemental educational context and are not derived from the Weekly Input.
- Quotations. Quotations appearing throughout this week's commentary are attributed to Warren Buffett, Mark Twain, Bill Gates, Benjamin Graham, John Maynard Keynes, Winston Churchill, and Albert Szent-Györgyi. Quotations labeled “commonly attributed” should be treated as such rather than as verified primary-source quotations.
- Important Disclosure. The Weekly Input reflects the author's opinions and is provided for informational and educational purposes. Forward-looking statements may change and should not be regarded as forecasts or guarantees. Illustrative numerical examples are hypothetical, diversification and risk management cannot guarantee profits or prevent losses, and the pace and investment implications of technological change cannot be predicted reliably.
Disclosures:
- Securities offered through LPL Financial, Member FINRA/SIPC. Investment Advice offered through WCG Wealth Advisors, LLC, a Registered Investment Advisor. WCG Wealth Advisors, LLC is a separate entity from LPL Financial.
- Bond yields are subject to change. Certain call or special redemption features may exist which could impact yield. (118-LPL)
- The S&P 500 is a stock market index tracking the stock performance of 500 of the largest companies listed on stock exchanges in the United States. Indexes are unmanaged and cannot be invested in directly. (102-LPL)
- The NASDAQ Composite Index measures all NASDAQ domestic and non-U.S. based common stocks listed on The NASDAQ Stock Market. The market value, the last sale price multiplied by total shares outstanding, is calculated throughout the trading day, and is related to the total value of the Index. Indexes are unmanaged and cannot be invested in directly. (112-LPL)
- The fast price swings in commodities will result in significant volatility in an investor’s holdings. Commodities include increased risks, such as political, economic, and currency instability, and may not be suitable for all investors. (122-LPL)
- There is no guarantee that a diversified portfolio will enhance overall returns or outperform a non-diversified portfolio. Diversification does not protect against market risk. (26-LPL)
The Russell 2000 Index is generally representative of the 2,000 smallest companies by market capitalization in the Russell 3000 index, which represents approximately 10% of the total market capitalization of the Russell 3000 Index. Indexes are unmanaged and cannot be invested in directly. Bonds are subject to market and interest rate risk if sold prior to maturity. Bond values will decline as interest rates rise. Bonds are subject to availability, change in price, call features and credit risk. The fast price swings in commodities will result in significant volatility in an investor’s holdings. Commodities include increased risks, such as political, economic, and currency instability, and may not be suitable for all investors.
Securities offered through LPL Financial, Member FINRA/SIPC. Investment Advice offered through WCG Wealth Advisors, LLC, a Registered Investment Advisor. WCG Wealth Advisors, LLC is a separate entity from LPL Financial.
1182580-092826