


Market Strategy
by Talley Leger, Chief Market Strategist
August 21, 2026
S&P 500: The Tug of War Between Earnings & Interest Rates
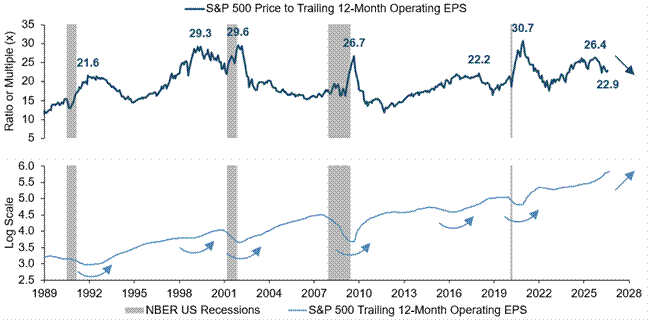
Investors committing capital to US stocks at all-time highs may have an understandable feeling of vertigo. However, a look under the hood reveals an encouraging reality. S&P 500 trailing 12-month operating earnings per share (EPS) have been rising faster [+26% year to date (YTD)] than share prices (+13% YTD), meaning the stock market is literally growing into its price-to-earnings (P/E) ratio.
Specifically, the S&P 500 trailing P/E multiple has compressed from its recent peak of 26.4x in October 2025 to its current level of 22.9x, which should ease some of the anxiety about lofty valuations (see the chart below). Historically, equities have performed best in periods of rising earnings, regardless of whether multiples were expanding or contracting.*
Denominator Effect: The US Stock Market Has Been Growing into Its P/E Ratio
Sources: FRED, S&P Global, WCG, 08/19/26. Notes: NBER = National Bureau of Economic Research. EPS = Earnings per share.
Two of the most important determinants of share prices – earnings ($340) and interest rates (6.4%) – are in visible conflict. To quantify their tug of war and estimate the “intrinsic” value of the S&P 500, I developed a simple bivariate regression model based on the natural logarithms of: 1) Moody’s seasoned 20-year Baa corporate bond yield; and 2) S&P 500 trailing 12-month operating EPS (see the chart below).
Stocks Are Rich, But There May Be Plenty of Room for Upside
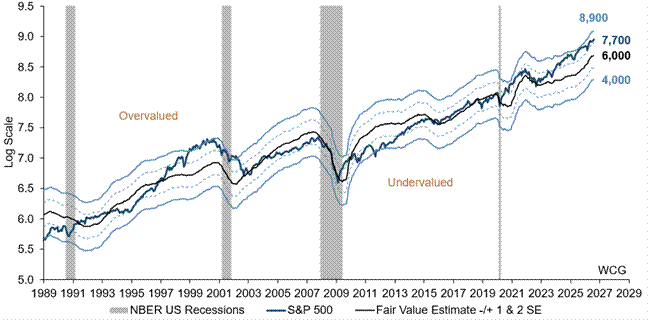
Sources: FRED, S&P Global, WCG, 08/19/26. Notes: SE = Standard error. R square = 0.92. Interval of estimation = 01/89 - 01/24. Out of sample period = 01/24 - 08/26.
While stocks are undeniably expensive, they haven’t yet entered the “nosebleed” valuation territory of the 1999-2000 “dot.com” bubble. True, the index sits +30% above its “fair” value estimate of 6,000, but there may be plenty of room for upside. Indeed, we could enjoy an additional +10% increase to our S&P 500 price target of 8,500 in 2026, with a potential “blowoff” top (+15%) above the +2 standard error threshold of 8,900 (see the chart above).
Pathways to More Reasonable Valuations
How do changes in earnings and interest rates affect the “intrinsic” value estimate of the S&P 500?
- Earnings Power:Given a strong coefficient of 0.96 (t statistic = 32.57), earnings (along the horizontal axis) are by far the dominant driver of stock prices (see the table below).
- Cost of Capital:Despite a weaker coefficient of -0.21 (t statistic = -3.11), the long-duration investment-grade corporate bond yield (down the vertical axis) is an appropriate discount rate for assessing how much investors should be willing to pay for those earnings (see the table below).
S&P 500 “Fair” Value Sensitivity to Earnings Changes (Horizontal) & Rate Changes (Vertical)
 Sources: FRED, Moody’s, S&P Global, WCG, 08/19/26. Notes: Baa = Investment grade. Light blue box = “Fair” value estimate based on the current level of earnings and interest rates.
To be clear, this valuation model isn’t a short-term timing tool that provides precise buy / sell signals. Rather, it’s a general gauge of the prospective risk / reward embedded in US equities relative to their “intrinsic” value.
Bottom Line
Strong expected earnings growth alongside a favorable operating climate – including the U.S. Department of the Treasury’s recent announcement to double its purchases of longer-dated nominal coupon securities, lower energy prices, cooler inflation and softer bond yields – together should alleviate the stock market’s overvalued condition by raising its “fair” value baseline.
*Market Strategy Flash,Why Earnings Growth Wins Big 83% of the Time, April 17, 2026.
General Model Specification
Because we’re working with financial time series data, the model’s specified with a time subscript () and relies on a pure log-log framework, meaning the estimated coefficients represent constant elasticities:

Variable & Parameter Definitions
- ln(Yt): The dependent variable representing the natural log of the S&P 500 Index price level at timet.
- B0 (Beta zero): They-intercept representing the baseline expected value of the logged S&P 500 when all independent variables are theoretically equal to zero.
- B1 (Beta one): The estimated coefficient for the cost of capital. In this log-log model, it represents the interest rate elasticity – the expected percentage change in the S&P 500 for a1%change in the corporate bond yield, holding earnings constant.
- ln(X1,t): The natural log of Moody’s Seasoned 20-Year Baa Corporate Bond Yield at timet.
- B2 (Beta two): The estimated coefficient for earnings. It represents the earnings elasticity – the expected percentage change in the S&P 500 for a1%change in earnings, holding interest rates constant.
- ln(X2,t): The natural log of S&P 500 Trailing 12-Month Operating EPS at timet.
- et(Epsilon): The stochastic error term (or residual) at timet. It captures the variance in stock prices that’s entirely unexplained by earnings or interest rates (e.g., exogenous geopolitical shocks, sudden safety or liquidity premia, behavior, sentiment, positioning).
“Intrinsic” Value Estimate Equation
Applying the coefficients from the table below, the working equation for our “fair” value estimate is:

Summary Output, Regression Stats & ANOVA
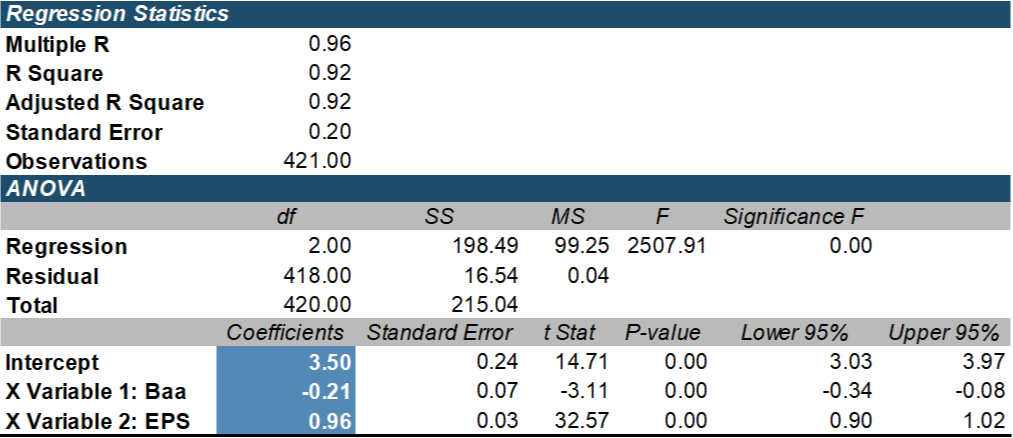
Sources:FRED, Moody’s, S&P Global, WCG, 08/19/26.Notes:ANOVA = Analysis of variance. Interval of estimation = 1/1989 - 1/2024. Light blue box = Coefficients in the working equation for our “fair” value estimate.
Portfolio Strategy
by Jim Worden, CFA®, CMT®, CAIA®, Chief Investment Officer
August 21, 2026
Is Momentum Getting a Bad Rap?
I’ve been blessed to learn from some of the great quantitative investors over the last couple of decades – William Sharpe, Cliff Asness, Rob Arnott, Andrew Lo , Jason Hsu, Michael Hunstad, Andrew Ang, Roger Clarke, and Harindra de Silva.
Since the late 1990s, we’ve been able to see firsthand how different factor strategies – value, momentum, quality, minimum volatility – perform in both good and bad periods, including during the Tech Bubble, the Global Financial Crisis, and the Pandemic and Post-Pandemic Inflation Surge. Below is a review of the performance of each of these factors through the lens and portfolio construction of MSCI’s USA factor indices.
Exhibit A: Tech Bubble (12/31/98-12/31/04, Source: Bloomberg)
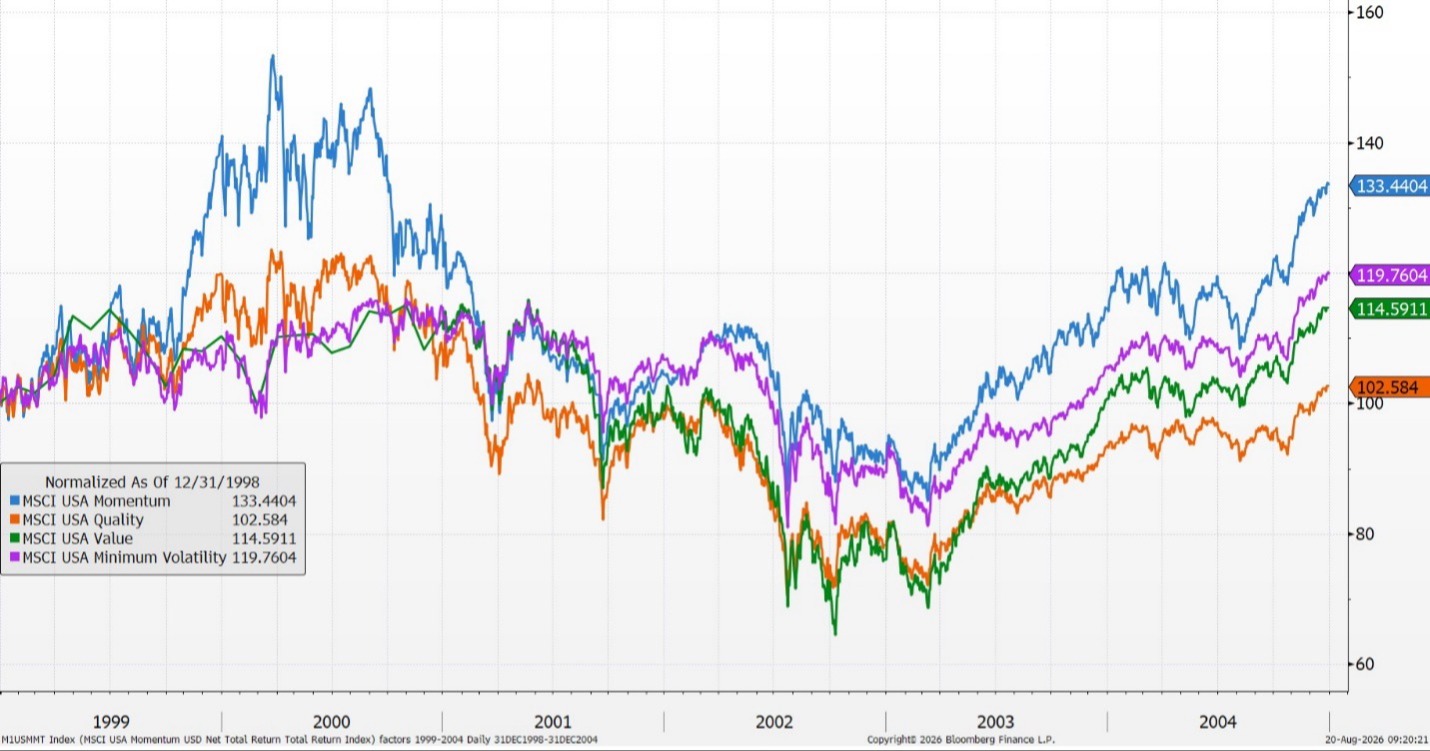
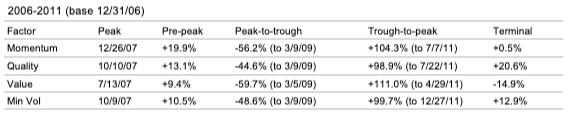
Exhibit B: Global Financial Crisis (12/31/06-12/31/11, Source: Bloomberg)
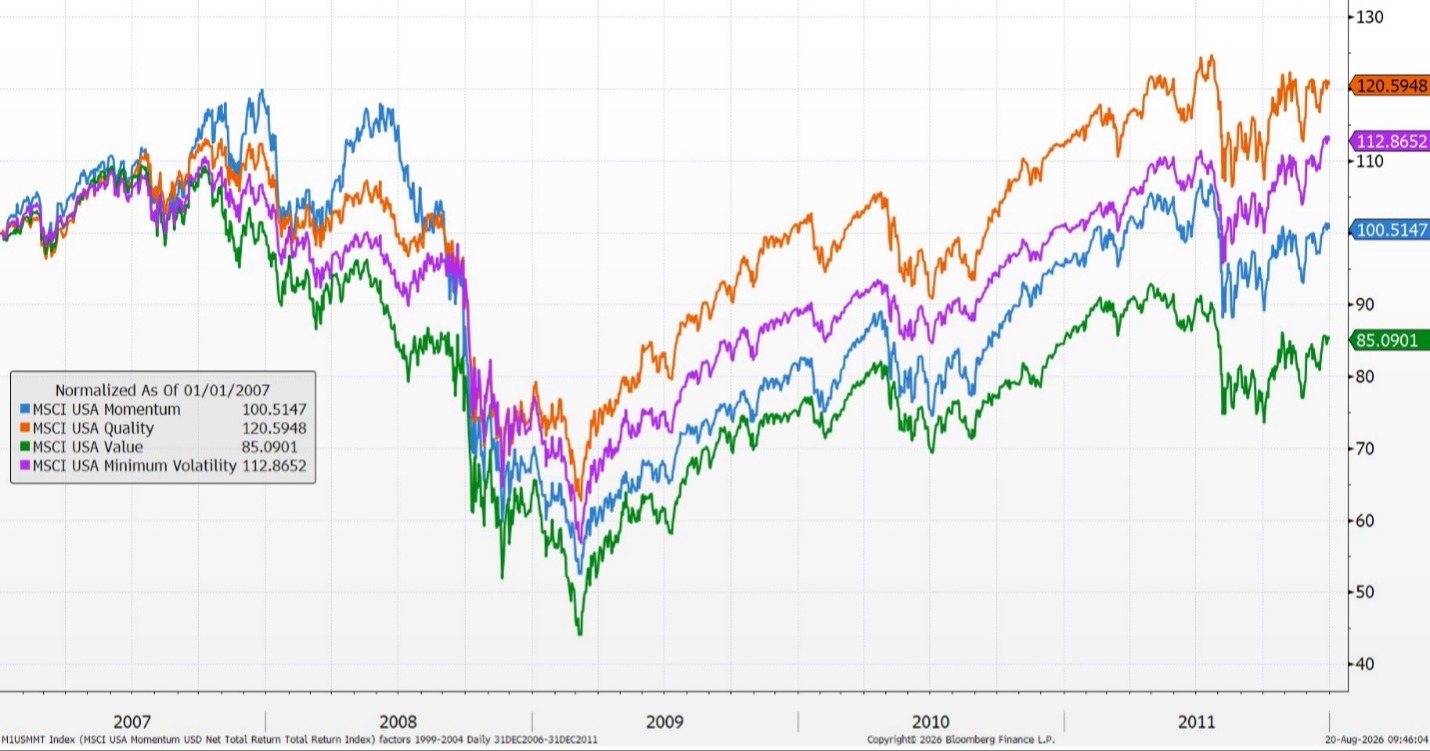
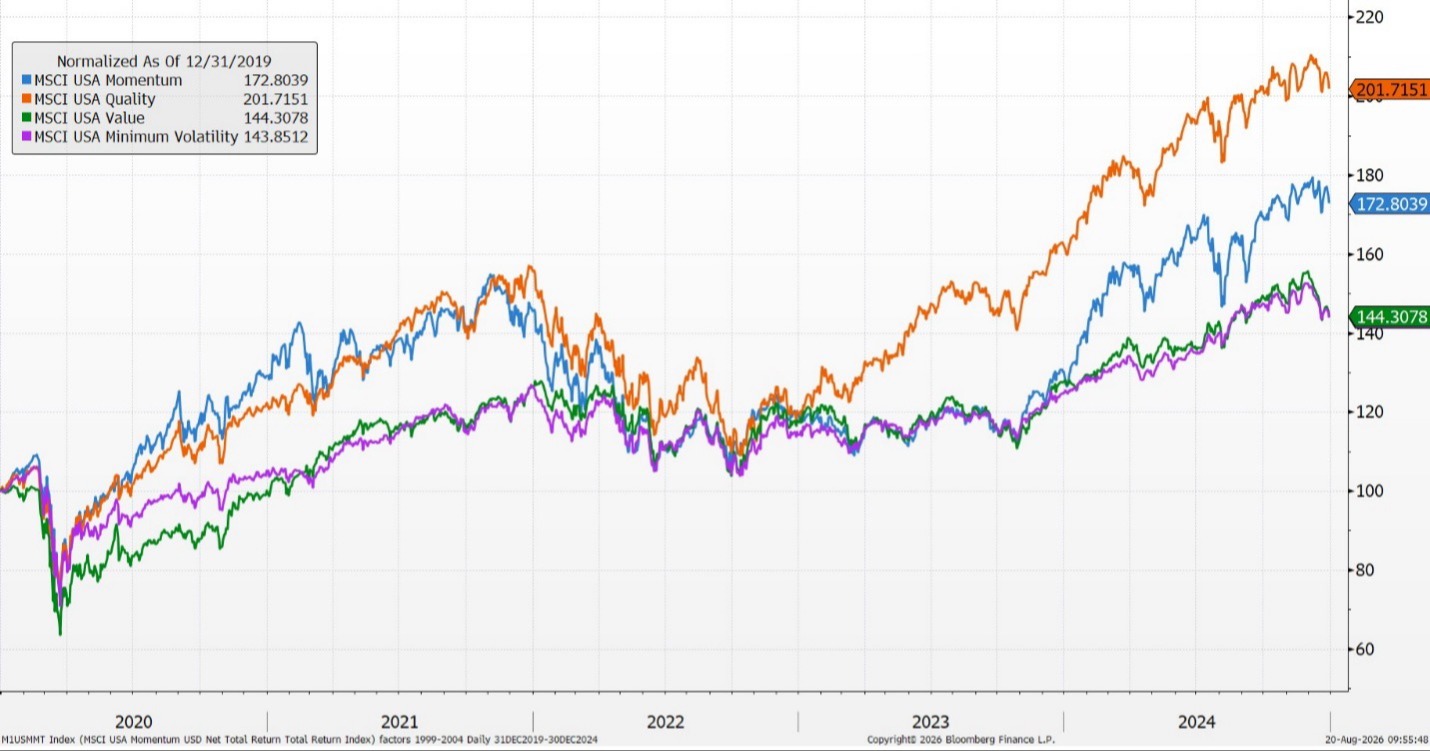
Exhibit C: Pandemic and Post-Pandemic Inflation Surge (12/31/19-12/31/24, Source: Bloomberg)
Source: Bloomberg
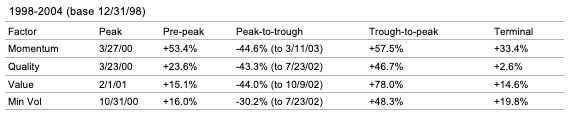
The Tech Bubble had the largest drawdown with momentum (-44.6%), but even with the lower trough-to-peak return (57.5%), momentum was up 33.4%, followed by minimum volatility (19.8%), value (14.6%), and quality (2.6%). This is mostly attributable to the pre-peak period in 1999 (53.4%). Even though many momentum stocks crashed hard, momentum was still the best performer through 12/31/04.
Minimum volatility had the lowest drawdown during the period (-30.2%) and that helped it come in second place for the period. Value had the best trough-to-peak performance of 78% from 2/1/01 to 10/9/02.
The Global Financial Crisis was also a good test for how the different factor models would perform. Momentum had the best performance (19.9%) leading up to the peak, but had the second-worst drawdown (-56.2%) of the group. Value had the lowest pre-peak performance (9.4%) but had the worst peak-to-trough performance (-59.7%). Quality was second-best for pre-peak performance (13.1%) and had the lowest drawdown from peak to trough (-44.6%), even lower than minimum volatility (-48.6%).
Trough-to-peak performance for the next period was solid for all factors – up between 99% and 111%. Since quality had the lowest drawdown and a solid pre-peak performance, it came in first with 20.6% for the entire five-year period. Momentum was flat (0.55%), minimum volatility was respectable (12.9%), and value was still under water at the end of the period (-14.9%).
In looking at the Pandemic and Post-Pandemic Inflation Surge, quality once again beat out the other factors – up 101% for the entire period. It was followed by momentum (71.9%), value (44.6%), and minimum volatility (44.0%).
We had pre-peak performance of between 1.3% (value) and 9.1% (momentum), but we had two peak-to-trough periods and two trough-to-peak periods. Quality performed best during the pandemic peak-to-trough period (-30.8%), followed by minimum volatility (-33.2%), momentum (-33.8%), and value (-37.3%).
All four factors performed well on the rebound coming out of the pandemic – momentum (114.6%), quality (113.5%), value (101.4%), and minimum volatility (78.9%), but only minimum volatility (-18.2%) and value (-18.8%) weathered the storm better during the Post-Pandemic Inflation Surge. Momentum (-31.9%) and quality (-30.6%) struggled during the second peak-to-trough period.
Coming out of the inflation period, however, quality (93.2%) and momentum (70.1%) rebounded much more than value (49.9%) and minimum volatility (47%).
It’s perhaps tempting coming out of each period to overweight the factor that performed the best and underweight the factor that performed the worst. Had investors overweighted value and underweighted quality, they would have reduced their exposure to the factor that subsequently performed best. Quality performed best and value performed worst in the next period.
It doesn’t always work out that way, however. This is why we believe maintaining diversified exposure across factors can make sense over a full market cycle, depending on an investor’s objectives, risk tolerance, and circumstances. That doesn’t mean there aren’t opportunities to tilt slightly more or less toward one factor based on fundamentals, technicals, or macroeconomic headwinds or tailwinds.
It’s also important to keep in mind starting points. Though quality outperformed momentum in the last period by nearly 29 percentage points, over the entire period (12/31/98 to 8/19/2026), momentum has outperformed quality by about 302 percentage points cumulatively. When we annualize that, it’s just under 1% better per year.
Exhibit D: All periods (12/31/98-8/19/26, Source: Bloomberg)
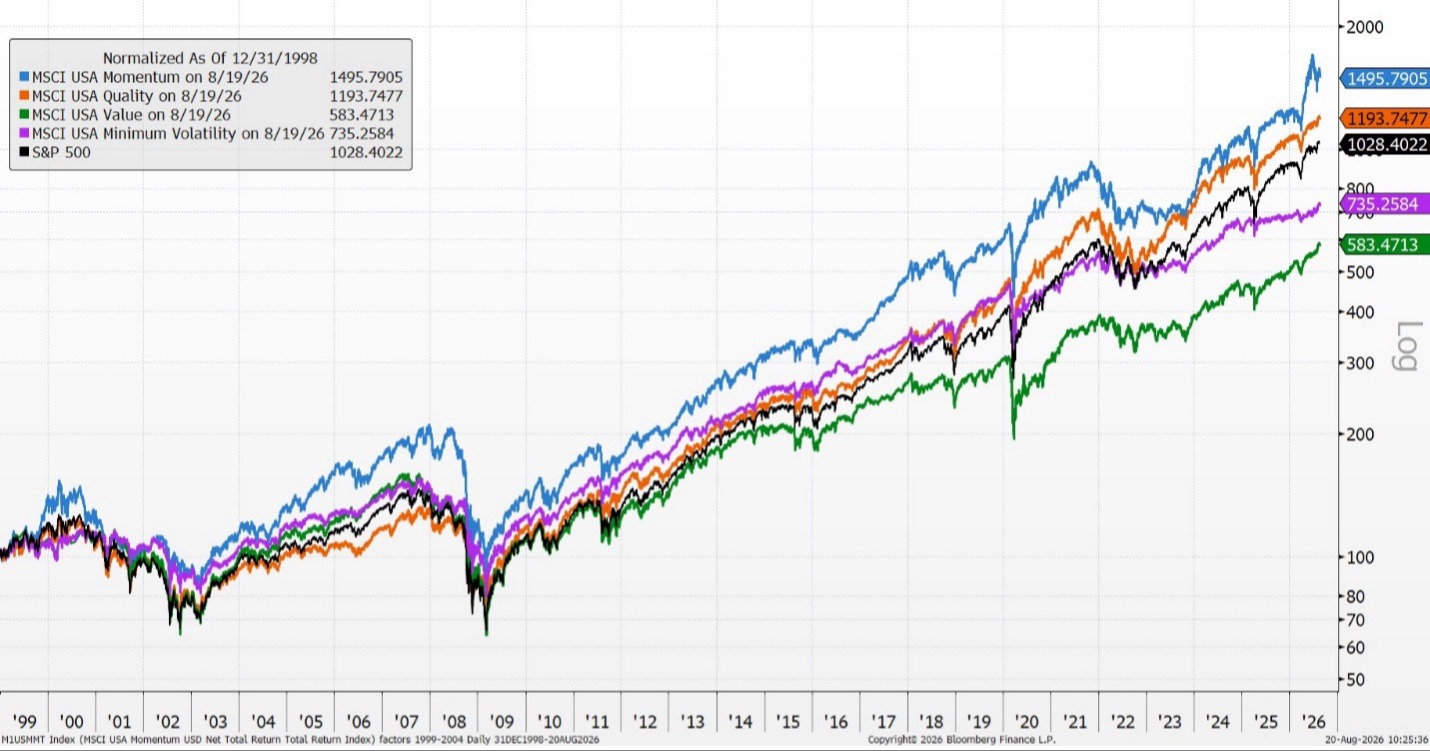
Momentum may be getting a bad rap right now as it is experiencing more volatility, but things can change. We definitely wouldn’t write off any factors completely, regardless of whether they appear to be working right now or not.
It’s possible that the next period could be different, with value or minimum volatility performing better. No one really knows exactly what will happen. This is why we are such strong believers in diversification.
Supporting Performance Tables
Source: Bloomberg

Definitions
S&P 500: A stock market index tracking the performance of 500 of the largest publicly traded companies in the United States. It serves as a primary benchmark for the overall health of the U.S. stock market.
Operating EPS: A company’s net profit from regular business operations divided by its outstanding shares, excluding one-time gains or losses. It shows how much profit a company generates from its core everyday business.
P/E: A financial metric calculated by dividing a company’s current stock price by its EPS. It shows how much investors are willing to pay for every dollar of the company’s profit.
NBER Recession: A significant decline in economic activity spread across the economy, lasting more than a few months, as officially designated by the National Bureau of Economic Research. It is determined by analyzing factors like gross domestic product, income and employment.
Moody’s Seasoned 20-Year Baa Corporate Bond Yield: The average interest rate paid on corporate bonds with a 20-year maturity that are rated Baa, which represents medium-grade investment bonds with moderate credit risk. It serves as a key benchmark for corporate borrowing costs.
Natural Logarithm: A mathematical function that determines the exponent to which the constant e (approximately 2.718) must be raised to equal a given number. It is widely used in finance and science to model continuous growth rates.
Standard Error: A statistical metric that measures how much a sample mean is expected to deviate from the true population mean. A lower standard error indicates that the sample data provides a more accurate estimate of the whole population.
R-Square (Coefficient of Determination): A statistical measure that indicates the percentage of variance in a dependent variable that can be explained by an independent variable in a regression model. It ranges from 0 to 1, where higher values show a stronger fit between the data and the model.
Factor investing: An investment approach that seeks systematic exposure to characteristics that have historically been associated with differences in risk and return across securities.
Momentum: A factor that emphasizes securities with relatively stronger recent price performance compared with other securities in the investment universe.
Quality: A factor that emphasizes companies with characteristics such as stronger profitability, earnings quality, financial strength, and/or more stable fundamentals, depending on the index methodology.
Value: A factor that emphasizes securities trading at relatively lower valuations based on measures such as price-to-book, price-to-earnings, or other fundamental valuation metrics, depending on the index methodology.
Minimum volatility: A factor strategy designed to construct a portfolio with lower expected or realized volatility than a broad parent universe, subject to the index provider’s methodology and constraints.
Pre-peak performance: The percentage change from the beginning of the stated analysis period to the identified market or index peak used in the analysis.
Drawdown / peak-to-trough return: The percentage decline from a prior peak to a subsequent trough over the period being measured.
Trough-to-peak return: The percentage gain from an identified trough to a subsequent peak over the period being measured.
Cumulative return: The total percentage change over a stated period, without converting the result to an annual rate.
Annualized return: The compounded average annual rate of return that links a beginning value to an ending value over the stated measurement period.
Diversification: The practice of spreading exposure across investments, strategies, or risk factors. Diversification does not ensure a profit or protect against loss.
Disclosures
This material is provided for educational and informational purposes only and is not individualized investment advice, an offer to buy or sell any security, or a recommendation to pursue any particular investment strategy. Views and observations are as of August 20, 2026, while performance data are through August 19, 2026, and are subject to change. Past performance is not indicative of future results. No investment strategy or factor exposure can assure a profit or protect against loss.
The exhibits and performance figures refer to unmanaged indexes and do not represent the performance of an actual client account or investment strategy. Indexes are not available for direct investment and generally do not reflect advisory fees, transaction costs, taxes, or other expenses that would reduce an investor’s actual return. All index series shown are total return indices and assume reinvestment of distributions. Performance figures in this material are based on changes in the Bloomberg/MSCI total return index levels for the dates stated. Percentages may be rounded.
Data and index information are sourced from Bloomberg and the applicable index providers and are believed to be reliable; however, accuracy and completeness are not guaranteed. Factor index methodologies differ and may produce materially different sector, security, risk, and return exposures. Historical period labels and peak/trough dates are used for explanatory purposes based on the date ranges shown; different starting points, ending points, or peak/trough selections may produce different results. Any discussion of factor tilts is general in nature and should be evaluated in light of an investor’s objectives, risk tolerance, time horizon, tax circumstances, and other relevant considerations.
The views expressed are for informational and educational purposes only and are subject to change without notice.
This material is not intended as, and should not be interpreted as, individualized investment advice or a recommendation to buy, sell, or hold any security, sector, industry, or investment strategy.
References to specific companies, securities, sectors, or industries are for illustrative purposes only and should not be construed as investment recommendations.
Investing involves risk, including the possible loss of principal. Investments in a specific industry or sector may involve greater risk and volatility than more diversified investments.
Past performance is not indicative of future results. No investment strategy can guarantee a profit or protect against loss.
Forward-looking statements, including views about future demand, pricing, supply, or industry cycles, are based on current expectations and assumptions and are subject to risks and uncertainties. Actual results may differ materially.
Data and information are believed to be reliable, but accuracy, completeness, and timeliness are not guaranteed. Source documents should be retained for factual claims, third-party research references, and company-specific data.
Portfolio holdings, allocations, and risk budgets are subject to change based on market conditions, client objectives, and investment guidelines.
The author, firm, clients, or related persons may hold positions in securities mentioned and may buy or sell those securities without notice, subject to applicable policies and regulations.
Securities offered through LPL Financial, Member FINRA/SIPC. Investment Advice offered through WCG Wealth Advisors, LLC, an SEC Registered Investment Advisor. WCG Wealth Advisors, LLC and The Wealth Consulting Group are separate entities from LPL Financial. Index performance is shown for illustrative purposes only and does not predict or depict the performance of any investment. Past performance does not guarantee future results.
All information in this report is believed to be from reliable sources; however, WCG Wealth Advisors, LLC, makes no representation as to its completeness or accuracy.
In general, stock values fluctuate, sometimes widely, in response to activities specific to the companies as well as broad market, economic and political conditions. Stock investing involves risks, including fluctuating prices and loss of principal. Value investments can perform differently from the market as a whole. They can remain undervalued by the market for long periods of time. (135-LPL) International investing involves special risks such as currency fluctuation and political instability and may not be suitable for all investors. These risks are often heightened for investments in emerging markets. (93-LPL)
The fast price swings in commodities will result in significant volatility in an investor’s holdings. Commodities include increased risks, such as political, economic, and currency instability, and may not be suitable for all investors. (122-LPL)
Rebalancing a portfolio may cause investors to incur tax liabilities and/or transaction costs and does not assure a profit or protect against a loss. (28-LPL)
There is no guarantee that a diversified portfolio will enhance overall returns or outperform a non-diversified portfolio. Diversification does not protect against market risk. (26-LPL)
Standard deviation is a historical measure of the variability of returns relative to the average annual return. If a portfolio has a high standard deviation, its returns have been volatile. A low standard deviation indicates returns have been less volatile. (131-LPL)
This is for educational / general purposes only, does not constitute investment, tax or legal advice and should not be relied on as such. This is not to be construed as an offer to buy or sell any financial instruments. Any strategies discussed are not intended to be relied upon as the sole factor in making an investment decision for any individual. As with all investments there are associated inherent risks. Please obtain and review all financial material carefully before investing. All material presented is compiled from sources believed to be reliable and current, but accuracy cannot be guaranteed. The opinions voiced in this material are for general information only and are not intended to provide specific advice or recommendations for any individual. All performance referenced is historical and is no guarantee of future results. All indices are unmanaged and may not be invested in directly. These comments should not be construed as recommendations but as an illustration of broader themes.
Forward-looking statements are not guarantees of future results. They involve risks, uncertainties and assumptions; there can be no assurance that actual results will not differ materially from expectations. In addition, forward-looking statements, including index targets or market scenarios, are hypothetical in nature, reflect current views and assumptions and are subject to change based on market and economic conditions and are not guarantees of future performance. This is a hypothetical example and is not representative of any specific investment. Your results may vary. (88-LPL) Scenario outcomes are illustrative and not predictive. This does not constitute a recommendation of any investment strategy or product for a particular investor. Investors should consult a financial professional before making any investment decisions.
The S&P 500 is a stock market index tracking the stock performance of 500 of the largest companies listed on stock exchanges in the United States. Indexes are unmanaged and cannot be invested in directly. (102-LPL)
Government bonds and Treasury bills are guaranteed by the US government as to the timely payment of principal and interest and, if held to maturity, offer a fixed rate of return and fixed principal value.
Publication Date: August 21, 2026
For Public Use in the US
The Wealth Consulting Group
LPL1163347