
2021 Q1 Update - Investment Strategy Committee Notes
ISC Model Updates Q1:
The market, as represented by the S&P 500 below, continued its move higher in the first quarter albeit not quite at the same torrid pace it finished the year. There was also some significant dispersion between sectors, and the outperformance of all things, not mega-cap growth continued from last quarter.
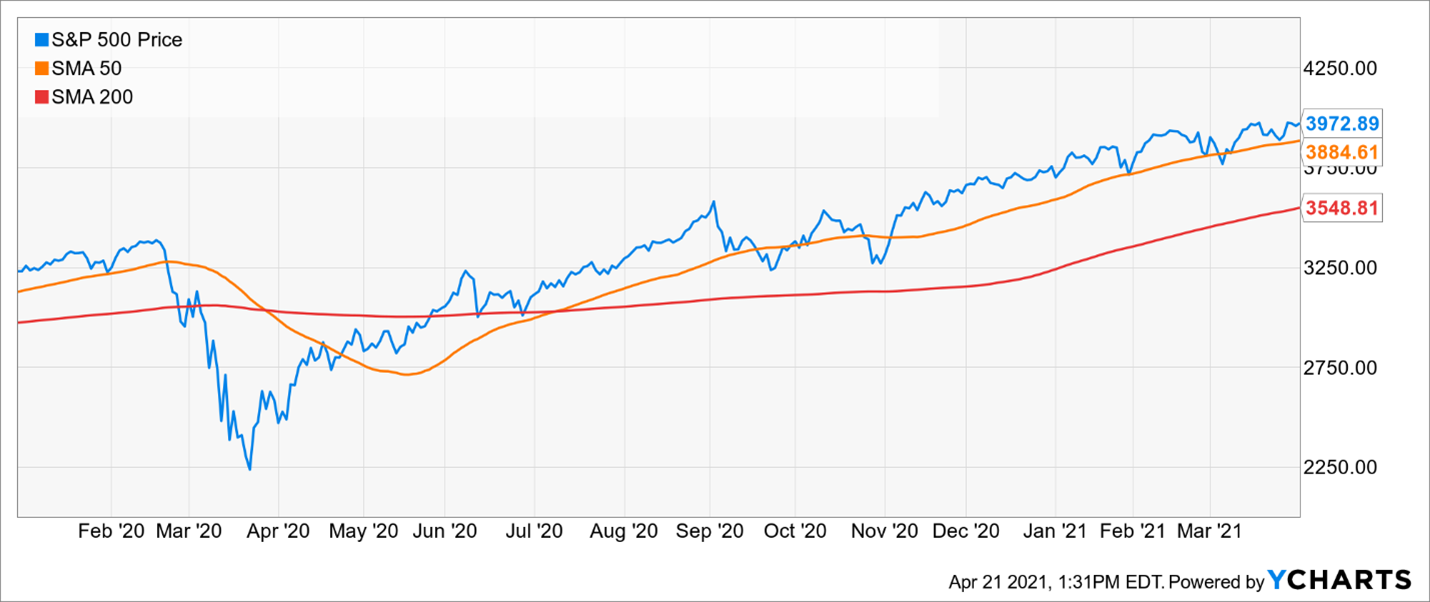
However, the steady grind higher has been punctuated by some panic-inducing volatility shocks that have coincided with or perhaps were caused by, several high-profile institutional manager implosions and deleveraging episodes. Bookended by Melvin Capital, with their alleged defeat at the hands of the Reddit WallStreetBets army, and Archegos Capital, with one of the more stunning and instantaneous reversals of a single individual’s fortune, markets have quickly found their footing in the wake of both as volatility continues to set new lows for this nascent recovery.
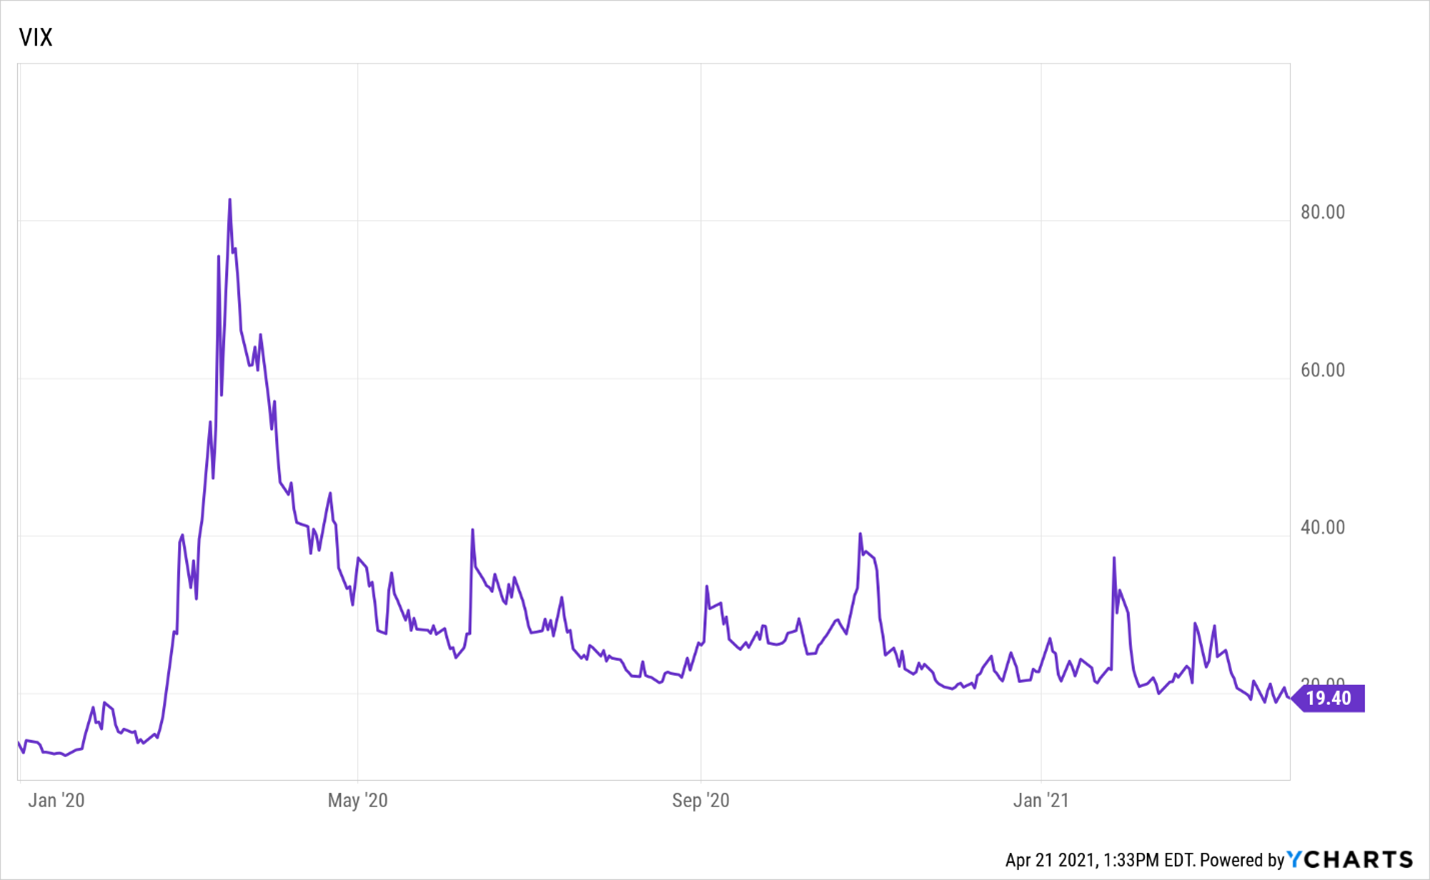
The VIX closed the quarter sub-20.
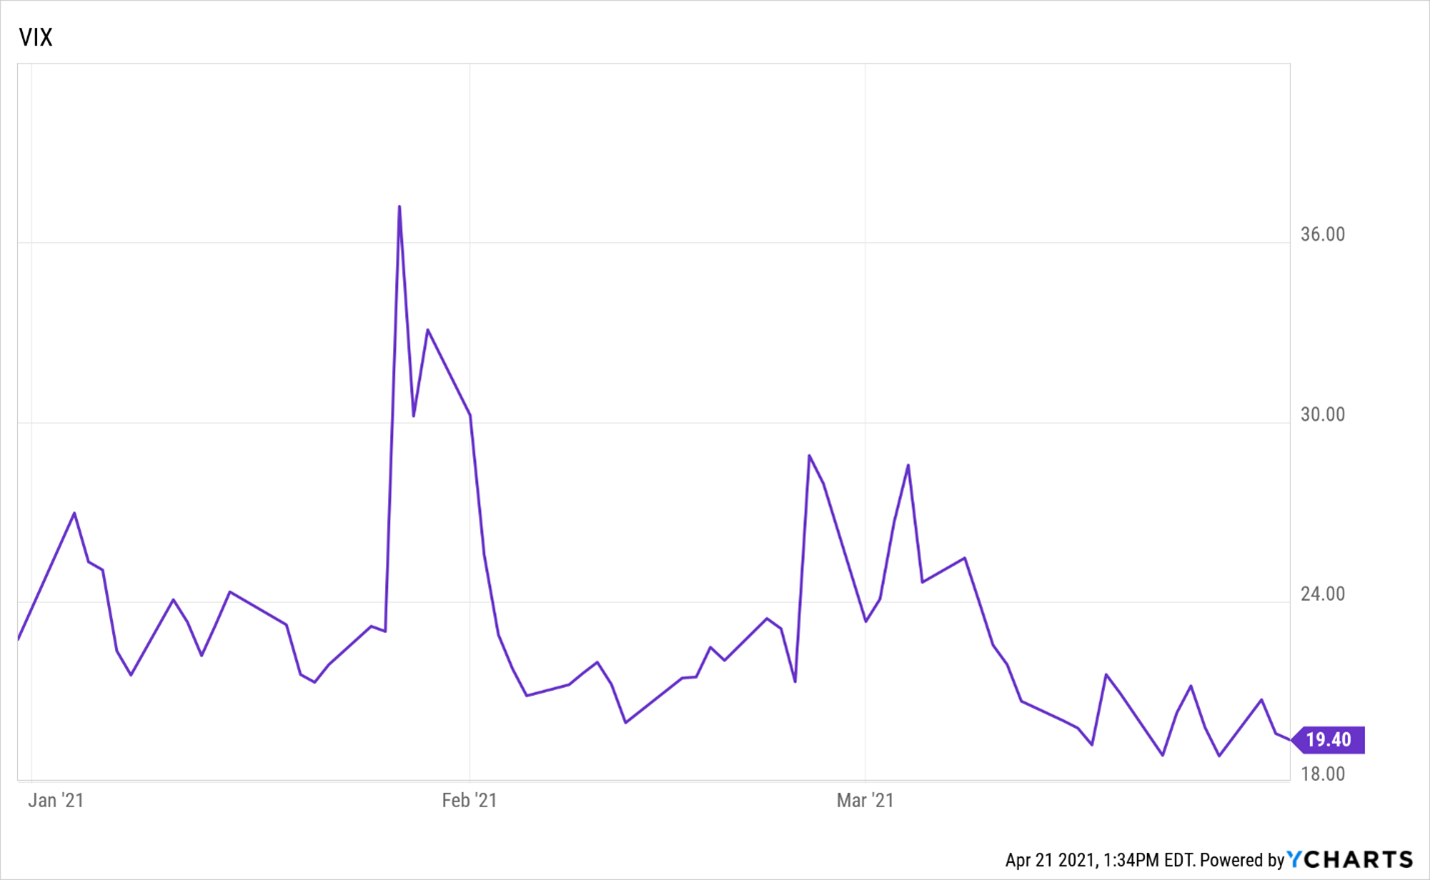
And every spike in volatility this year has quickly dissipated.
As was mentioned above, the quarter’s gains were driven by the emergent cyclical leadership that started to take hold in Q4. The historic levels of concentration seen in the market have also been much discussed. Typically, these levels of concentration have unwound during recessions and bear markets. With a recession and a bear market behind us, are we witnessing a more peaceful transition of power to new leaders?
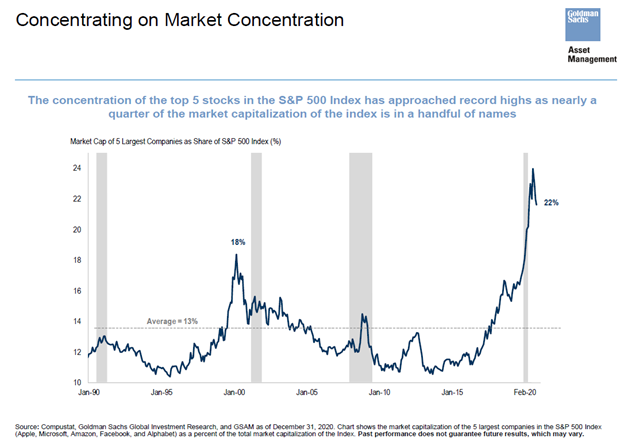
The sector homes of those big five stocks: Communication Services for Facebook and Alphabet, Technology for Apple and Microsoft, and Consumer Discretionary for Amazon were up, but they lagged their cyclical peers by a wide margin in most cases.
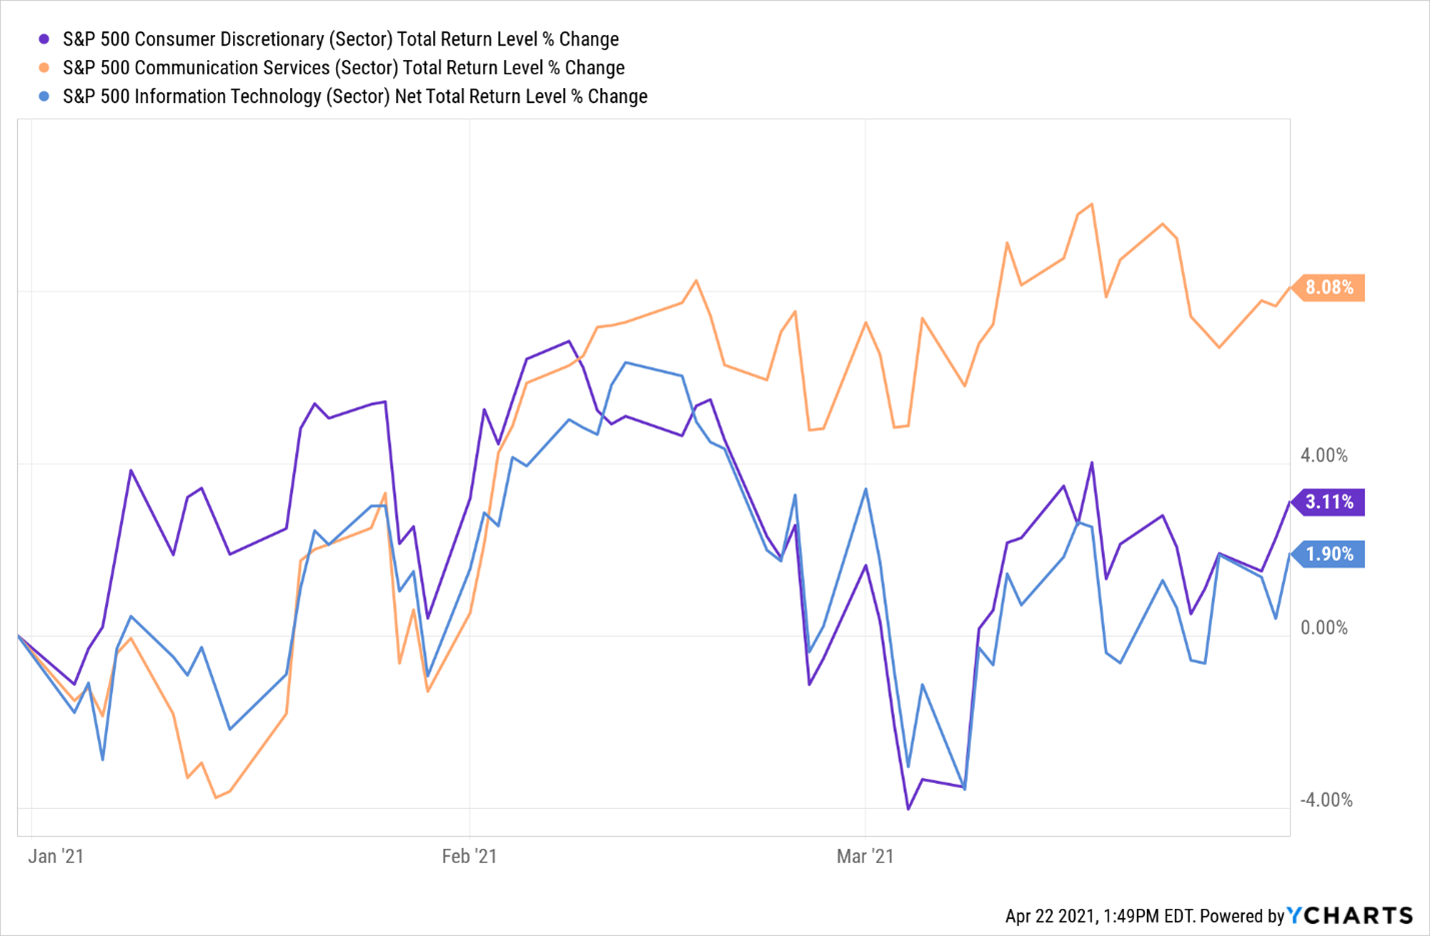
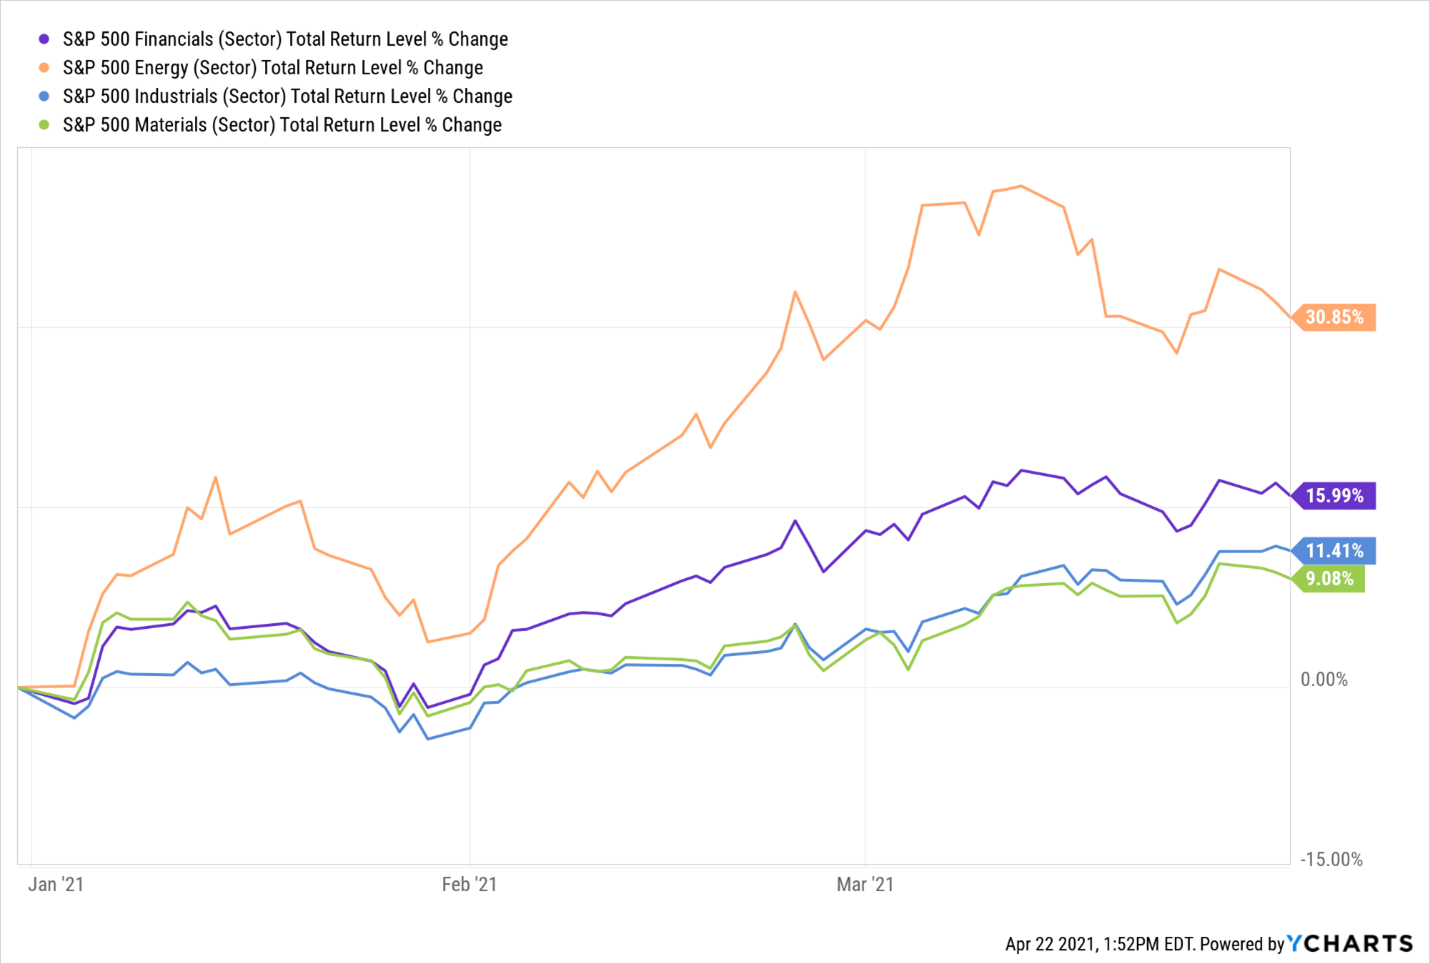
As seen below, the more cyclical sensitive sectors of Energy, Financials, Industrials, and Materials, which combined only equal 28.5% of the S&P 500 as of quarter-end, outperformed. For comparison, the five behemoths still account for over 21% of the S&P 500 and an over 46% combined weighting for their respective sectors.
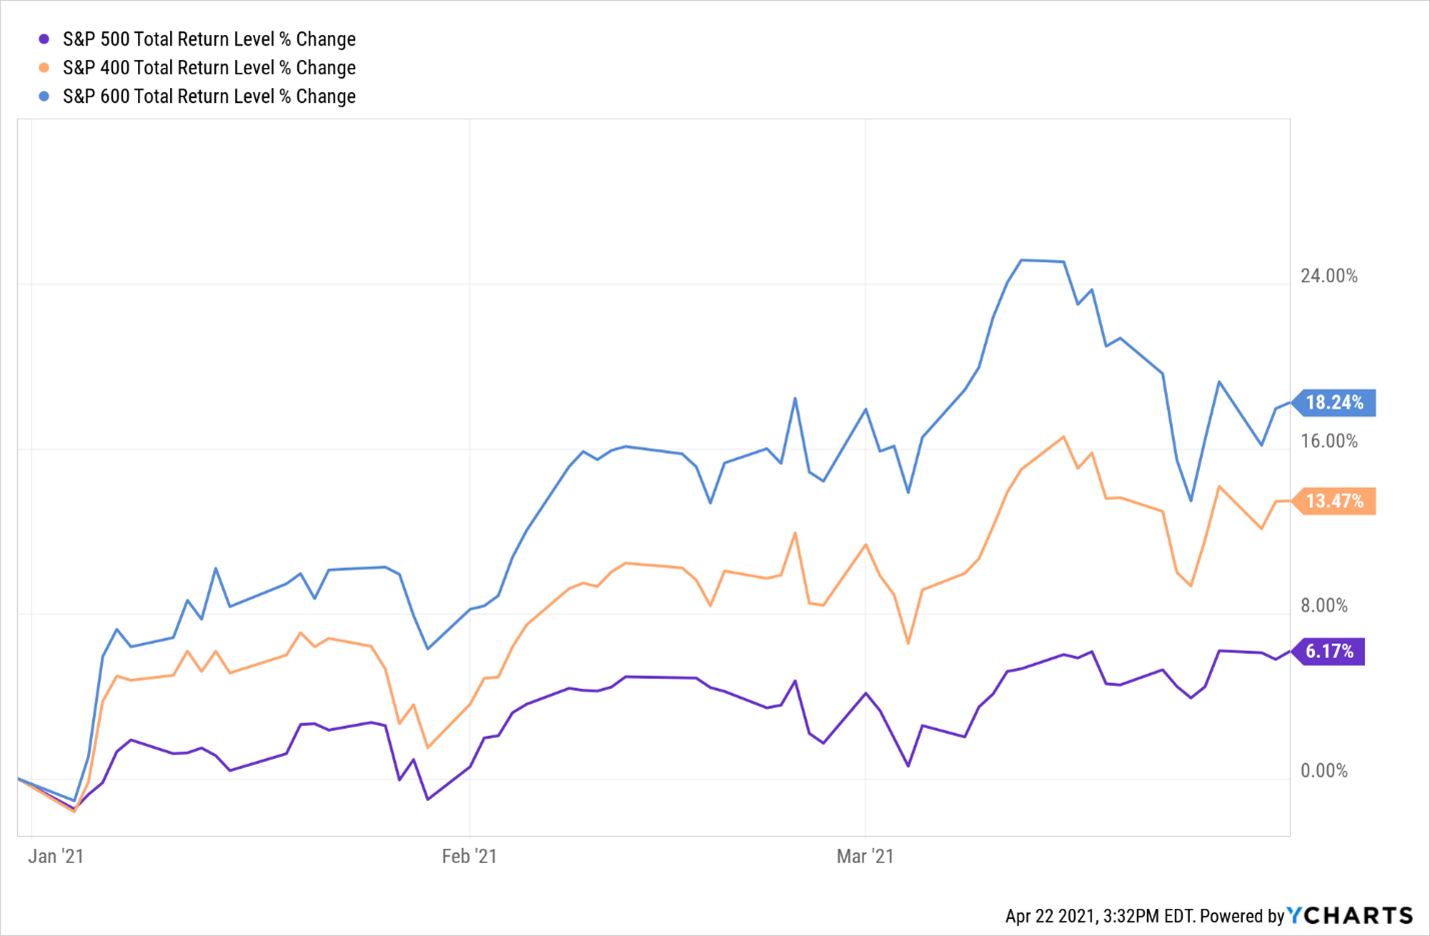
Small and mid-capitalization companies similarly outperformed large as well.
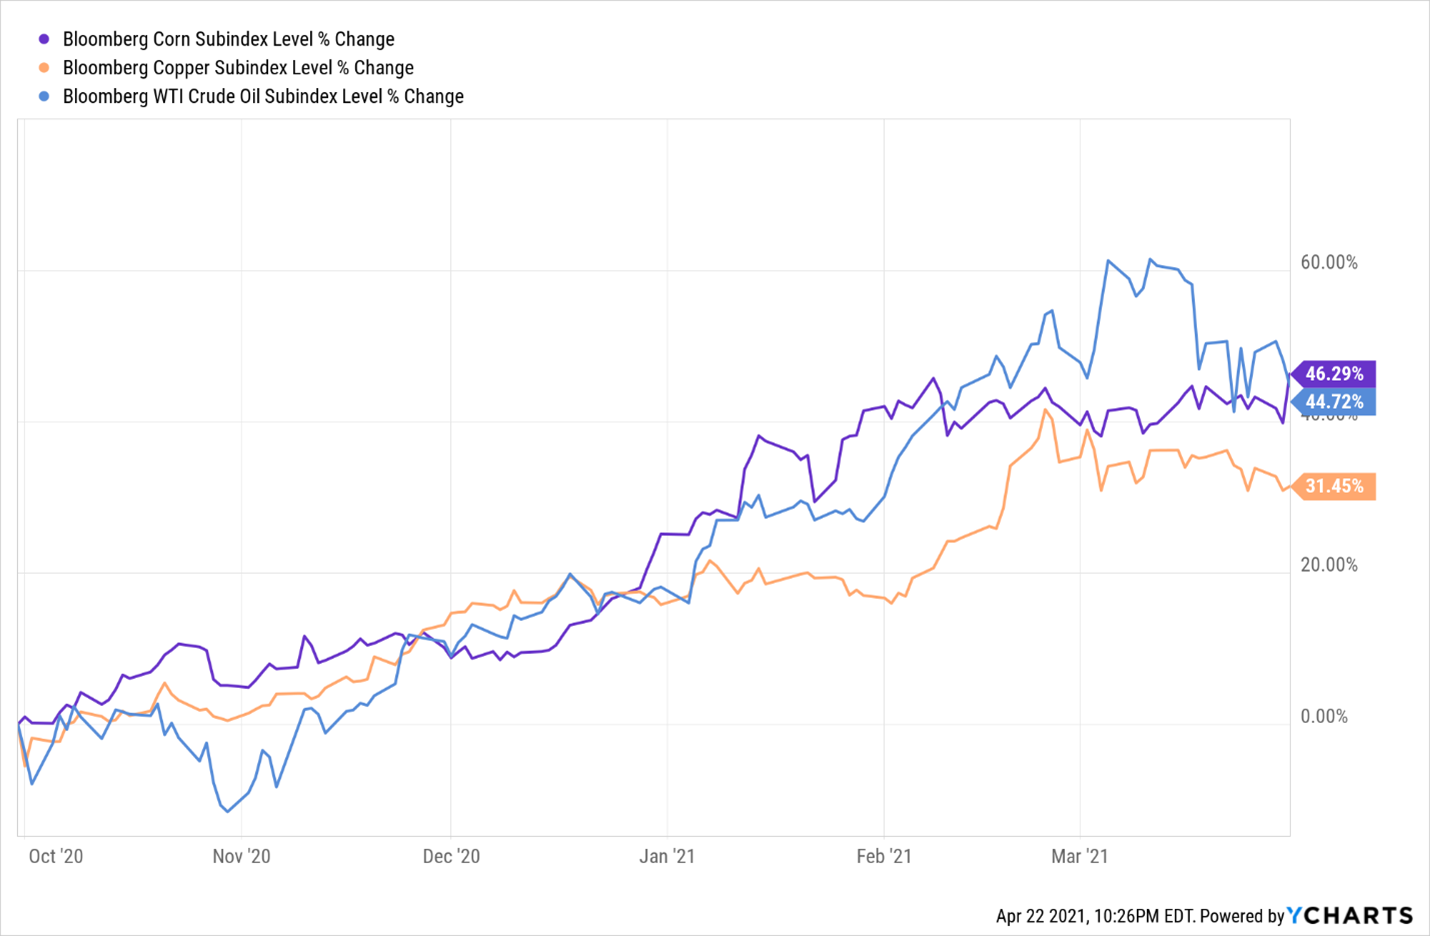
This change in leadership has likely been a result of market expectations of exceptionally strong economic data for the first half of the year. Additionally, sectors like Materials and Energy have been the beneficiary of a strong move in commodities. Corn, copper, and oil are all up north of 30% from Q4 of 2020 through Q1 of this year.
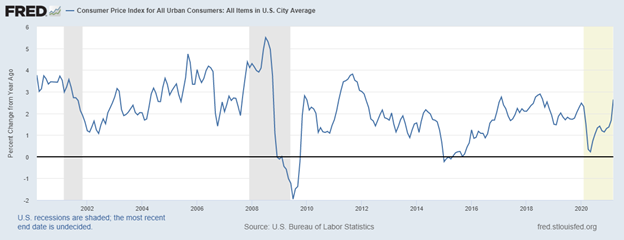
The strong bounce in growth, the rise in commodity prices, and Covid related supply constraints have all led to inflation picking up steam both in actual data and narrative form. The month of March registered a .6% monthly uptick in inflation and a 2.6% year over year change. Energy jumped off the chart with a roughly 13% year over year increase.
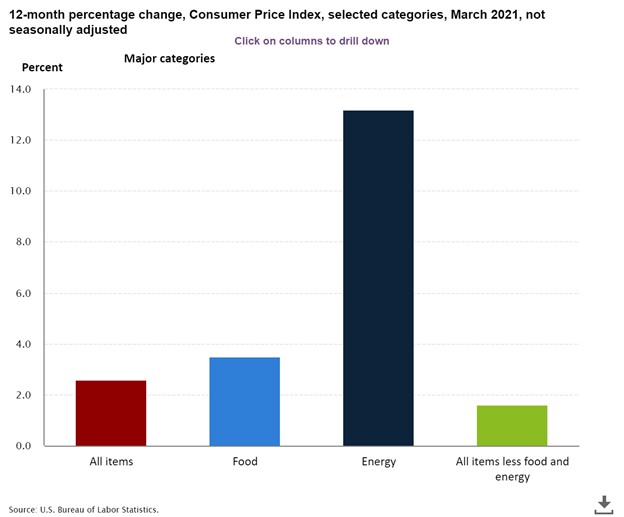
This was among the higher rates of change seen going back 9 years.
Interest rates had been late to the reflation party and spent the quarter playing catch-up rallying 81bps. This was likely another contributor to the outperformance of cyclicals particularly financials which stand to benefit from higher rates and a steeper yield curve.
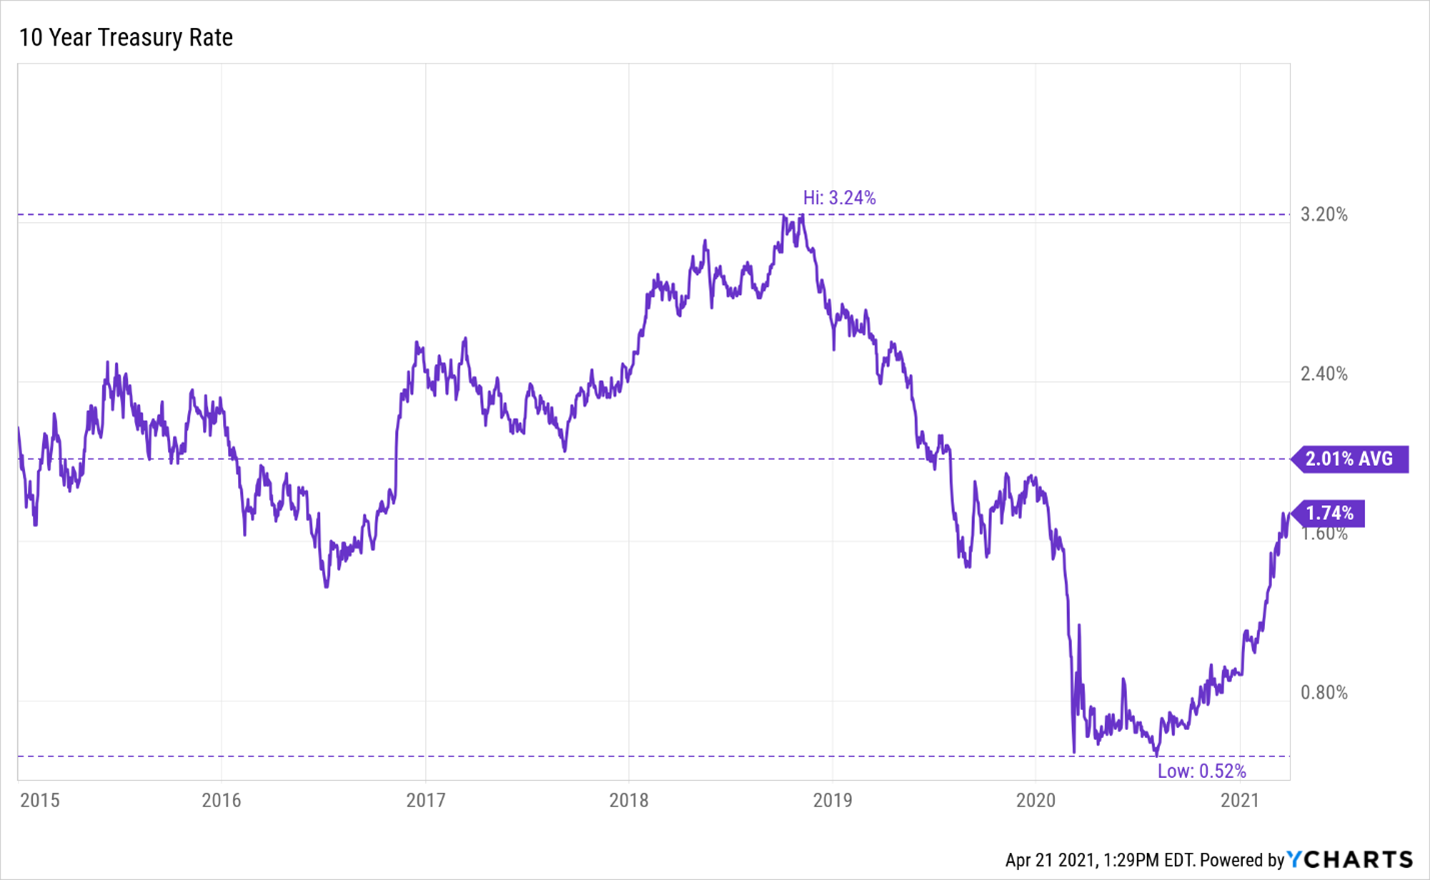
Under more “normal” conditions, interest rates would likely be a lot higher in response to the projected growth and inflation outlook. Global rates have been rising but remain historically low. In the case of other major sovereign issuers like Japan or Germany, rates remain well below that of the U.S. This likely continues to exert downward pressure on U.S. rates. In addition, the Fed’s QE purchases loom large. Lastly, many market participants seem to believe this cyclical upswing in growth and inflation will be transitory in nature, and once base effects and Covid related supply disruptions abate, we will resume the more tepid growth and inflation that characterized the post-GFC recovery.
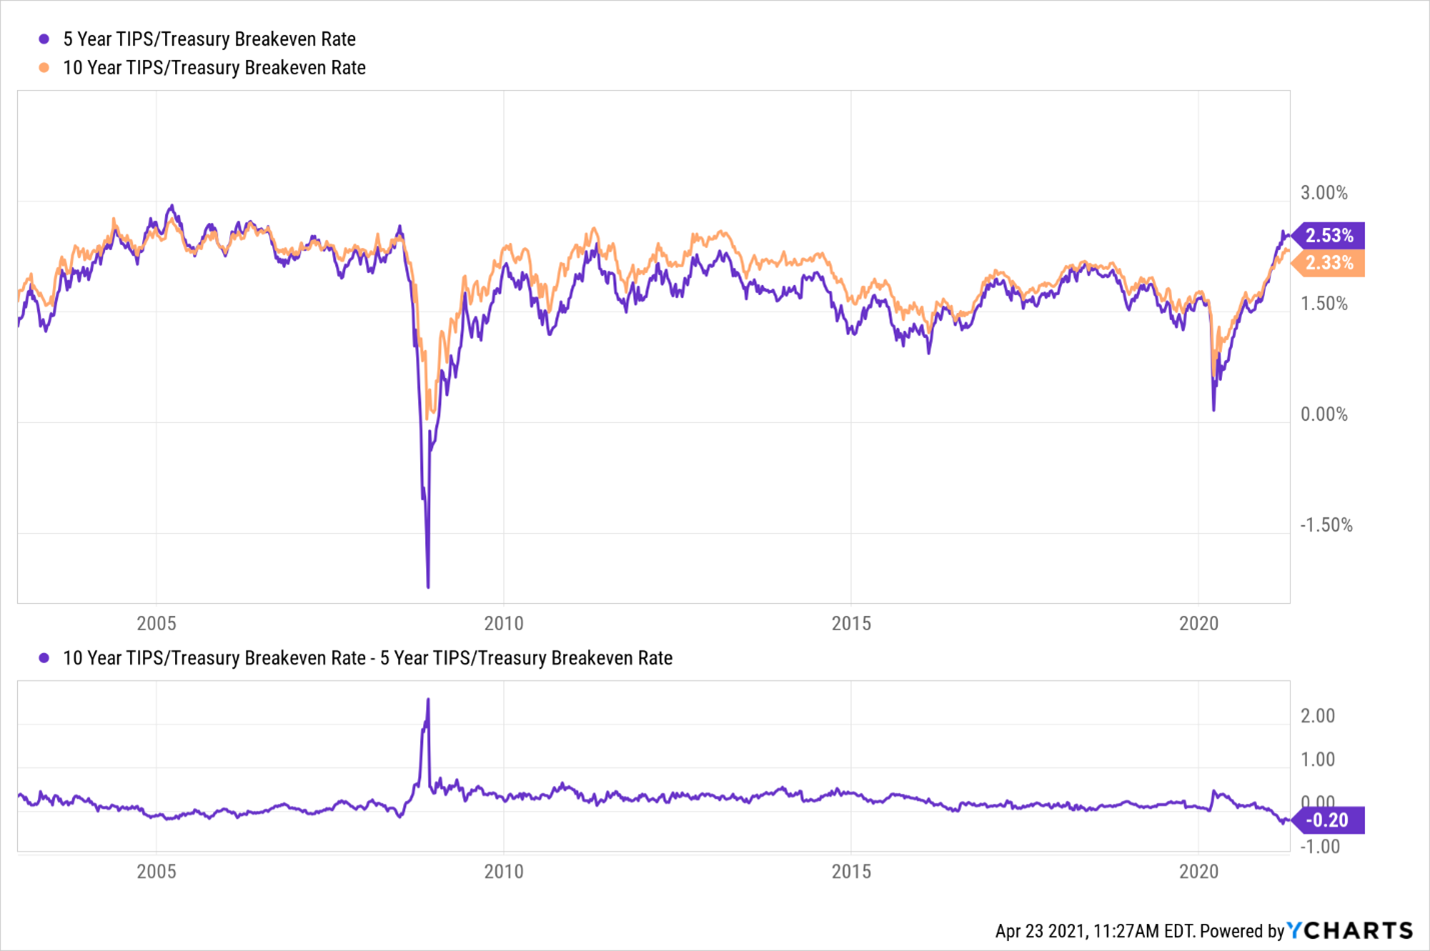
To the latter point, 5- and 10-year breakeven inflation rates, as seen below, derive a market assumed rate of inflation by comparing inflation-indexed and non-inflation indexed bonds of the same maturity. Curiously, the market’s expectation for inflation over the next five years is higher than over the next ten. While both numbers imply inflation exceeding the Fed’s target, is the lower implied inflation ten years out versus five the market signaling some disbelief over the longer-term persistence of inflation?
The great inflation versus deflation/disinflation debate could reach a fever pitch in the second quarter should the data continue at its blistering pace. However, the resolution likely rests in large part on the shoulders of policymakers and their commitment to seemingly favor a full and sustained recovery in employment over extinguishing any early embers of inflation.
Annual Rebalance Changes:
In light of the investment committee’s views around the potential for continued declines in the dollar and at a minimum a cyclical surge in inflation, model changes were made during the course of the annual rebalance. These changes primarily focused on the fixed income side to help better insulate the portfolio from rising rates. Broadly speaking, duration was reduced, and additional credit exposure was added. Lastly, developed international was increased funded by a modest reduction of the large-cap exposure.
Disclosures
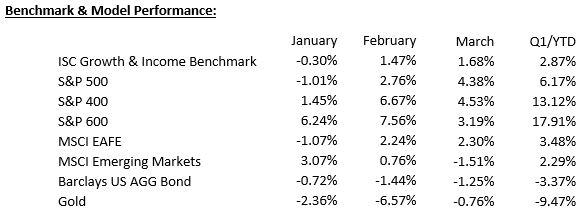
The ISC Growth & Income Benchmark is a blend of 33% S&P 500, 9.6% S&P 400, 2.4% S&P 600, 10.8% MSCI EAFE, 4.2% MSCI Emerging Markets, 37% Barclays Aggregate, and 3% Cash.
The opinions voiced in this material are for general information only and are not intended to provide specific advice or recommendations for any individual. All performance referenced is historical and is no guarantee of future results. All indices are unmanaged and may not be invested directly.
The economic forecasts set forth in this material may not develop as predicted and there can be no guarantee that strategies promoted will be successful.
Investing in stock includes numerous specific risks including the fluctuation of dividend, loss of principal, and potential illiquidity of the investment in a falling market.
The prices of small and mid-cap stocks are generally more volatile than large-cap stocks.
Bonds are subject to market and interest rate risk if sold prior to maturity. Bond values will decline as interest rates rise and bonds are subject to availability and change in price.
The fast price swings in commodities and currencies will result in significant volatility in an investor’s holdings.
International investing involves special risks such as currency fluctuation and political instability and may not be suitable for all investors. These risks are often heightened for investments in emerging markets.
WCG Wealth Advisors, The Wealth Consulting Group, and LPL Financial are not affiliated with any of the entities referenced.
The S&P 500 Index is a capitalization-weighted index of 500 stocks designed to measure the performance of the broad domestic economy through chanced in the aggregate market value of 500 stocks representing all major industries
The S&P Midcap 400 Stock Index is an unmanaged index generally representative of the market for the stocks of mid-sized US companies.
The S&P Small Cap 600 Index is an unmanaged index generally representative of the market for the stocks of small capitalized U.S. companies.
The MSCI EAFE Index is a free float-adjusted market capitalization index that is designed to measure the equity market performance of developed markets, excluding the US & Canada.
The MSCI EM (Emerging Markets) Index is a free float-adjusted market capitalization-weighted index that is designed to measure the equity market performance of the emerging market countries of the Americas, Europe, the Middle East, Africa, and Asia.
The Bloomberg Barclays U.S Aggregate Bond Index is an index of the U.S. investment-grade bond market, including both government and corporate bonds.
The Cboe Volatility Index, or VIX, is a real-time market index representing the market's expectations for volatility over the coming 30 days. Investors use the VIX to measure the level of risk, fear, or stress in the market when making investment decisions.